L
Seller's Agent in 2013
LISTING MAINTENANCE
Century 21 Acre Realty
Estimated Value: $411,000 - $461,000
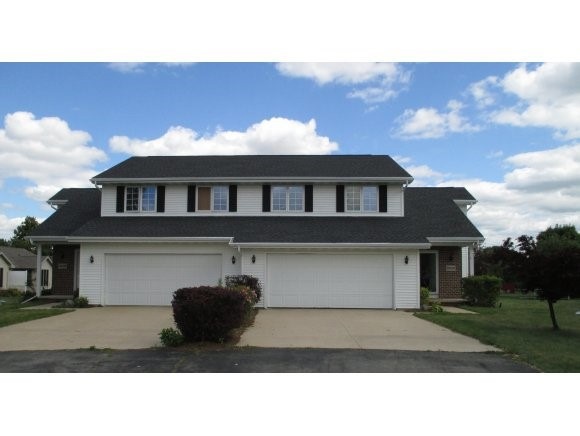
Great cul-de-sac location and great rental history. 2-story duplex with 2-story vaulted living room ceiling. 3 bedrooms up. Master features large walk-in closet with separate bathroom entrance. First floor laundry. Great yard. Each side has a deck and the N506 side has apple trees.
Last Agent to Sell the Property
LISTING MAINTENANCE
Century 21 Acre Realty Listed on: 08/13/2013
We collect this data history from publicly available records. To have your information removed, we recommend requesting removal directly through your county’s website.
| Date | Buyer | Sale Price | Title Company |
|---|---|---|---|
| Vandenavond Matthew | $217,000 | -- | |
| Hennessey Stacey L | $210,526 | -- |
| Date | Event | Price | List to Sale | Price per Sq Ft |
|---|---|---|---|---|
| 10/05/2013 10/05/13 | Sold | $217,000 | 0.0% | $75 / Sq Ft |
| 08/19/2013 08/19/13 | Pending | -- | -- | -- |
| 08/13/2013 08/13/13 | For Sale | $217,000 | -- | $75 / Sq Ft |
| Year | Tax Paid | Tax Assessment Tax Assessment Total Assessment is a certain percentage of the fair market value that is determined by local assessors to be the total taxable value of land and additions on the property. | Land | Improvement |
|---|---|---|---|---|
| 2024 | $4,504 | $379,500 | $40,700 | $338,800 |
| 2023 | $4,182 | $340,400 | $40,700 | $299,700 |
| 2022 | $4,332 | $315,000 | $40,700 | $274,300 |
| 2021 | $4,120 | $277,000 | $31,300 | $245,700 |
| 2020 | $4,283 | $254,900 | $31,300 | $223,600 |
| 2019 | $3,962 | $231,200 | $31,300 | $199,900 |
| 2018 | $3,754 | $220,600 | $31,300 | $189,300 |
| 2017 | $3,863 | $213,600 | $32,900 | $180,700 |
| 2016 | $4,062 | $213,600 | $32,900 | $180,700 |
| 2015 | $3,992 | $213,600 | $32,900 | $180,700 |
| 2014 | $4,058 | $213,600 | $32,900 | $180,700 |
| 2013 | $4,147 | $213,600 | $32,900 | $180,700 |
L
Seller's Agent in 2013
LISTING MAINTENANCE
Century 21 Acre Realty

Buyer's Agent in 2013
Stacey Hennessey
Acre Realty, Ltd.
(920) 470-9692
18 in this area
475 Total Sales
Source: REALTORS® Association of Northeast Wisconsin
MLS Number: 50082674
APN: 03-0-1813-00
Disclaimer: Certain information contained herein is derived from information provided by parties other than Homes.com. All information provided is deemed reliable, but is not guaranteed to be accurate and should be independently verified.
![]() Based on information submitted to the MLS GRID. All data is obtained from various sources and may not have been verified by broker or MLS GRID. Supplied Open House Information is subject to change without notice. All information should be independently reviewed and verified for accuracy. Properties may or may not be listed by the office/agent presenting the information. Some IDX listings have been excluded from this website. Copyright REALTORS Association of Northeast Wisconsin MLS, Inc. - All Rights Reserved
Based on information submitted to the MLS GRID. All data is obtained from various sources and may not have been verified by broker or MLS GRID. Supplied Open House Information is subject to change without notice. All information should be independently reviewed and verified for accuracy. Properties may or may not be listed by the office/agent presenting the information. Some IDX listings have been excluded from this website. Copyright REALTORS Association of Northeast Wisconsin MLS, Inc. - All Rights Reserved
Information received from other 3rd parties: All information deemed reliable but not guaranteed and should be independently verified. All properties are subject to prior sale, change, or withdrawal. Neither listing broker nor Ten-X nor RANW MLS shall be responsible for any typographical errors, misinformation, misprints, and shall be held totally harmless.
IDX information is provided exclusively for consumers’ personal, non-commercial use, that it may not be used for any purpose other than to identify prospective properties consumers may be interested in purchasing, and that the data is deemed reliable but is not guaranteed accurate by the MLS.
Based on information submitted to the MLS GRID
Ask me questions while you tour the home.