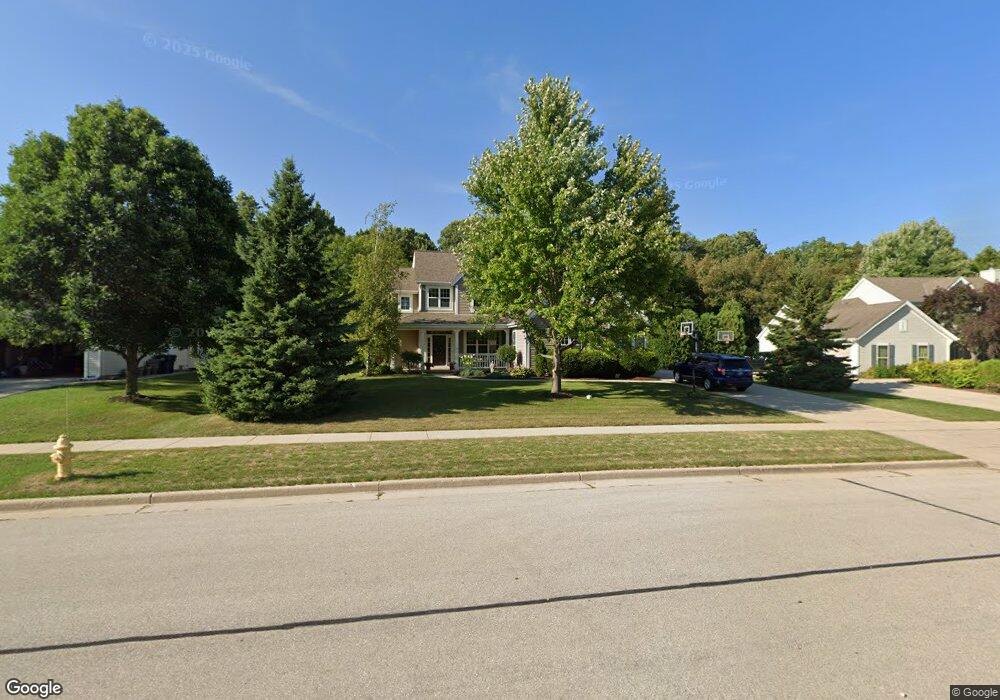
N75W24372 Overland Rd Sussex, WI 53089
Estimated Value: $610,764 - $682,000
4
Beds
3
Baths
2,445
Sq Ft
$266/Sq Ft
Est. Value
About This Home
This home is located at N75W24372 Overland Rd, Sussex, WI 53089 and is currently estimated at $649,691, approximately $265 per square foot. N75W24372 Overland Rd is a home located in Waukesha County with nearby schools including Templeton Middle School and Hamilton High School.
Ownership History
Date
Name
Owned For
Owner Type
Purchase Details
Closed on
Aug 24, 2015
Sold by
Kelly Larry D and Kelly Patricia A
Bought by
Tappa Lance and Tappa Angela
Current Estimated Value
Home Financials for this Owner
Home Financials are based on the most recent Mortgage that was taken out on this home.
Original Mortgage
$360,000
Outstanding Balance
$280,414
Interest Rate
3.75%
Mortgage Type
Adjustable Rate Mortgage/ARM
Estimated Equity
$369,277
Purchase Details
Closed on
Jun 22, 2001
Sold by
Butler Orendorf Group Llc
Bought by
Kelly Larry D
Home Financials for this Owner
Home Financials are based on the most recent Mortgage that was taken out on this home.
Original Mortgage
$472,000
Interest Rate
7.75%
Mortgage Type
Purchase Money Mortgage
Purchase Details
Closed on
Oct 30, 2000
Sold by
Centennial Oaks Llc
Bought by
Butler Orendorf Group Llc
Home Financials for this Owner
Home Financials are based on the most recent Mortgage that was taken out on this home.
Original Mortgage
$190,400
Interest Rate
7.91%
Mortgage Type
Construction
Create a Home Valuation Report for This Property
The Home Valuation Report is an in-depth analysis detailing your home's value as well as a comparison with similar homes in the area
Home Values in the Area
Average Home Value in this Area
Purchase History
| Date | Buyer | Sale Price | Title Company |
|---|---|---|---|
| Tappa Lance | $385,000 | None Available | |
| Kelly Larry D | $301,100 | -- | |
| Butler Orendorf Group Llc | $67,900 | -- |
Source: Public Records
Mortgage History
| Date | Status | Borrower | Loan Amount |
|---|---|---|---|
| Open | Tappa Lance | $360,000 | |
| Previous Owner | Kelly Larry D | $472,000 | |
| Previous Owner | Butler Orendorf Group Llc | $190,400 |
Source: Public Records
Tax History Compared to Growth
Tax History
| Year | Tax Paid | Tax Assessment Tax Assessment Total Assessment is a certain percentage of the fair market value that is determined by local assessors to be the total taxable value of land and additions on the property. | Land | Improvement |
|---|---|---|---|---|
| 2024 | $6,298 | $518,600 | $115,000 | $403,600 |
| 2023 | $5,859 | $471,000 | $115,000 | $356,000 |
| 2022 | $5,835 | $417,600 | $103,500 | $314,100 |
| 2021 | $5,683 | $401,500 | $103,500 | $298,000 |
| 2020 | $5,372 | $357,500 | $103,500 | $254,000 |
| 2019 | $5,529 | $354,500 | $103,500 | $251,000 |
| 2018 | $5,364 | $349,400 | $98,400 | $251,000 |
| 2017 | $5,556 | $369,900 | $98,400 | $271,500 |
| 2016 | $5,622 | $361,400 | $98,400 | $263,000 |
| 2015 | $5,726 | $361,400 | $98,400 | $263,000 |
| 2014 | $5,651 | $357,700 | $98,400 | $259,300 |
| 2013 | $5,651 | $337,300 | $98,400 | $238,900 |
Source: Public Records
Map
Nearby Homes
- W247N7543 Overland Rd
- W243N7650 Hilltop Ct
- N76W24944 Ridgefield Dr
- N71W24818 Wildwood Way
- W238N7214 Michele Ln
- N66W25720 Big Sky Dr
- W233N7504 Highview Dr
- Lt0 Maple Ave
- W233N6997 Salem Dr
- Lt25 Five Iron Way
- N82W23452 Five Iron Way
- W279N6010 Serenity Dr
- N67W25396 Vail Ln
- N67W25502 Vail Ln
- N67W25606 Vail Ln
- N63W23954 Terrace Dr
- N70W25842 Coventry Ct
- W253N6628 Heavenly Ct
- W253N6563 Heavenly Ct
- N66W25683 Big Sky Dr
- N75W24390 Overland Rd
- N75W24354 Overland Rd
- N75W24408 Overland Rd
- N75W24336 N Woodsview Dr
- N75W24361 Overland Rd
- N75W24387 Overland Rd
- N75W24407 Overland Rd
- N75W24426 Overland Rd
- N75W24333 Overland Rd
- N75W24306 N Woodsview Dr
- W244N7546 White Tail Run
- N75W24444 Overland Rd
- N75W24288 N Woodsview Dr
- N75W24315 Overland Rd
- N75W24299 N Woodsview Dr
- W244N7644 Ridgefield Ct
- N74W24378 Red Tail Ct
- N74W24384 Red Tail Ct
- W244N7662 Ridgefield Ct
- N75W24464 Overland Rd