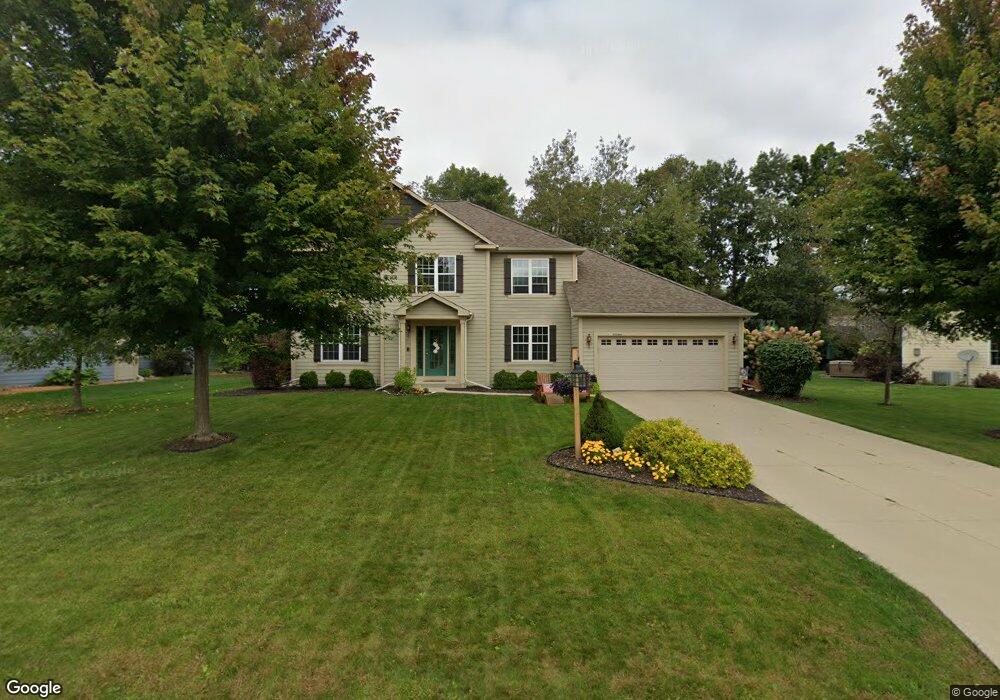
N77W22940 S Coldwater Cir Sussex, WI 53089
Estimated Value: $637,211 - $750,000
4
Beds
3
Baths
2,760
Sq Ft
$246/Sq Ft
Est. Value
About This Home
This home is located at N77W22940 S Coldwater Cir, Sussex, WI 53089 and is currently estimated at $680,053, approximately $246 per square foot. N77W22940 S Coldwater Cir is a home with nearby schools including Templeton Middle School, Hamilton High School, and St. John's Lutheran School.
Ownership History
Date
Name
Owned For
Owner Type
Purchase Details
Closed on
Sep 9, 2020
Sold by
Stover Michael C and Stover Briana C
Bought by
Sprosty Nicholas F and Sprosty Karla C
Current Estimated Value
Purchase Details
Closed on
Jun 21, 2013
Sold by
Carey Robert P and Carey Jennifer M
Bought by
Stover Michael C and Stover Briana C
Home Financials for this Owner
Home Financials are based on the most recent Mortgage that was taken out on this home.
Original Mortgage
$252,800
Interest Rate
3.52%
Mortgage Type
New Conventional
Purchase Details
Closed on
Aug 12, 2011
Sold by
Halen Homes Llc and Thistle Scott B
Bought by
Carey Robert P and Carey Jennifer M
Home Financials for this Owner
Home Financials are based on the most recent Mortgage that was taken out on this home.
Original Mortgage
$299,704
Interest Rate
4.5%
Mortgage Type
FHA
Purchase Details
Closed on
Aug 9, 2010
Sold by
M&I Regional Properties Llc
Bought by
Riverwood Properties Llc
Create a Home Valuation Report for This Property
The Home Valuation Report is an in-depth analysis detailing your home's value as well as a comparison with similar homes in the area
Home Values in the Area
Average Home Value in this Area
Purchase History
| Date | Buyer | Sale Price | Title Company |
|---|---|---|---|
| Sprosty Nicholas F | $464,000 | Frontier Title | |
| Stover Michael C | $316,000 | None Available | |
| Carey Robert P | $307,500 | None Available | |
| Riverwood Properties Llc | $50,000 | None Available |
Source: Public Records
Mortgage History
| Date | Status | Borrower | Loan Amount |
|---|---|---|---|
| Previous Owner | Stover Michael C | $252,800 | |
| Previous Owner | Carey Robert P | $299,704 |
Source: Public Records
Tax History Compared to Growth
Tax History
| Year | Tax Paid | Tax Assessment Tax Assessment Total Assessment is a certain percentage of the fair market value that is determined by local assessors to be the total taxable value of land and additions on the property. | Land | Improvement |
|---|---|---|---|---|
| 2024 | $7,217 | $593,200 | $103,500 | $489,700 |
| 2023 | $6,447 | $517,300 | $103,500 | $413,800 |
| 2022 | $6,630 | $473,400 | $97,000 | $376,400 |
| 2021 | $6,449 | $454,500 | $97,000 | $357,500 |
| 2020 | $5,623 | $374,000 | $97,000 | $277,000 |
| 2019 | $5,617 | $360,000 | $92,500 | $267,500 |
| 2018 | $5,434 | $353,900 | $86,400 | $267,500 |
| 2017 | $5,526 | $328,300 | $86,400 | $241,900 |
| 2016 | $4,962 | $319,400 | $86,400 | $233,000 |
| 2015 | $5,055 | $319,400 | $86,400 | $233,000 |
| 2014 | $5,247 | $316,000 | $86,400 | $229,600 |
| 2013 | $5,247 | $307,500 | $86,400 | $221,100 |
Source: Public Records
Map
Nearby Homes
- W226N8107 Longview Dr
- W233N7504 Highview Dr
- W234N7641 Grey Moss Ct
- Lt25 Five Iron Way
- N82W23452 Five Iron Way
- N75W22109 Cherry Hill Rd
- W222N8208 Plainview Pkwy
- W279N6010 Serenity Dr
- W233N6997 Salem Dr
- W238N7214 Michele Ln
- W227N8720 Tamarack Rd
- W220N7095 Town Line St
- N66W25514 Beaver Creek Ln
- W247N7543 Overland Rd
- W243N7650 Hilltop Ct
- N67W23470 Linda Dr
- W225N8982 Jolyn Dr
- 21679 S Weather Edge Cir
- 21864 N Weather Edge Cir Unit A
- 7837 W Stone Ridge Dr
- N77W22960 S Coldwater Cir
- N77W22914 S Coldwater Cir
- N78W22953 N Coldwater Cir
- N78W22933 N Coldwater Cir
- N77W22980 S Coldwater Cir
- N77W22945 S Coldwater Cir
- N77W22925 S Coldwater Cir
- N78W22969 N Coldwater Cir
- N78W22915 N Coldwater Cir
- N77W22967 S Coldwater Cir
- N78W22989 N Coldwater Cir
- N77W23000 S Coldwater Cir
- N77W22919 S Coldwater Cir
- N77W22917 S Coldwater Cir
- N77W22989 S Coldwater Cir
- N77W22911 S Coldwater Cir
- N78W22906 N Coldwater Cir
- N78W23009 N Coldwater Cir
- N77W23022 S Coldwater Cir
- N78W22938 N Coldwater Cir