10 Fisher St Foxboro, MA 02035
About This Home
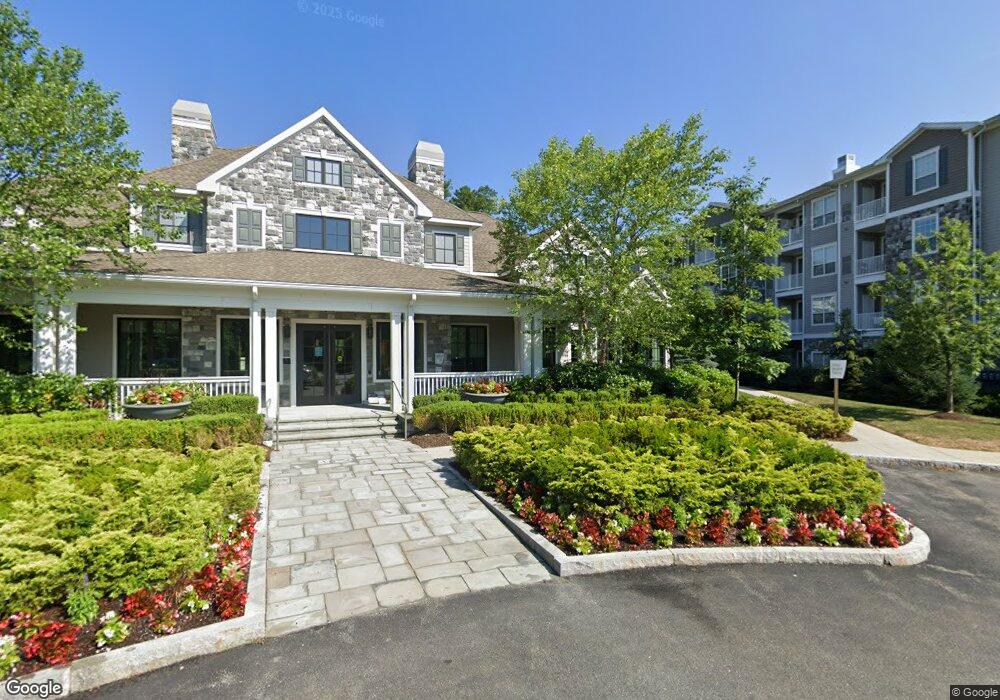
Revel in the tranquility of small-town living with big city amenities at The Sylvan. Located in the charming town of Foxborough, MA, The Sylvan is perfectly situated at the corridors of I-95 and I-495 providing quick and easy access to both Boston and Providence. Find a premier location coupled with well-designed, one-, two- and three-bedroom apartment homes featuring ultra-modern kitchen amenities like granite countertops, frameless cabinets, porcelain-tile flooring, stainless steel appliances and breakfast islands. Unwind at the spectacular pool with designated outdoor grilling and dining areas, a private media room with stadium seating and 24-hour techno-gym fitness center.
Home Values in the Area
Average Home Value in this Area
Property History
We collect this data history from publicly available records. To have your information removed, we recommend requesting removal directly through your county’s website.
| Date | Event | Price | List to Sale | Price per Sq Ft |
|---|---|---|---|---|
| 05/04/2026 05/04/26 | Off Market | -- | -- | -- |
| 06/21/2023 06/21/23 | For Rent | -- | -- | -- |
| 06/17/2023 06/17/23 | For Rent | -- | -- | -- |
| 06/07/2022 06/07/22 | For Rent | -- | -- | -- |
| 05/18/2022 05/18/22 | For Rent | -- | -- | -- |
Tax History
We collect this data history from publicly available records. To have your information removed, we recommend requesting removal directly through your county’s website.
| Year | Tax Paid | Tax Assessment Tax Assessment Total Assessment is a certain percentage of the fair market value that is determined by local assessors to be the total taxable value of land and additions on the property. | Land | Improvement |
|---|---|---|---|---|
| 2025 | $760,952 | $57,560,700 | $6,448,000 | $51,112,700 |
| 2024 | $759,401 | $56,210,300 | $6,448,000 | $49,762,300 |
| 2023 | $772,390 | $54,355,400 | $6,448,000 | $47,907,400 |
| 2022 | $757,613 | $52,177,200 | $6,448,000 | $45,729,200 |
| 2021 | $766,617 | $52,009,300 | $6,448,000 | $45,561,300 |
| 2020 | $699,497 | $48,009,400 | $6,448,000 | $41,561,400 |
| 2019 | $695,994 | $47,346,500 | $6,448,000 | $40,898,500 |
| 2018 | $48,489 | $42,155,000 | $6,448,000 | $35,707,000 |
| 2017 | $48,489 | $3,224,000 | $3,224,000 | $0 |
| 2016 | $13,991 | $792,700 | $792,700 | $0 |
| 2015 | $13,888 | $792,700 | $792,700 | $0 |
| 2014 | $13,547 | $792,700 | $792,700 | $0 |
Map
Ask me questions while you tour the home.