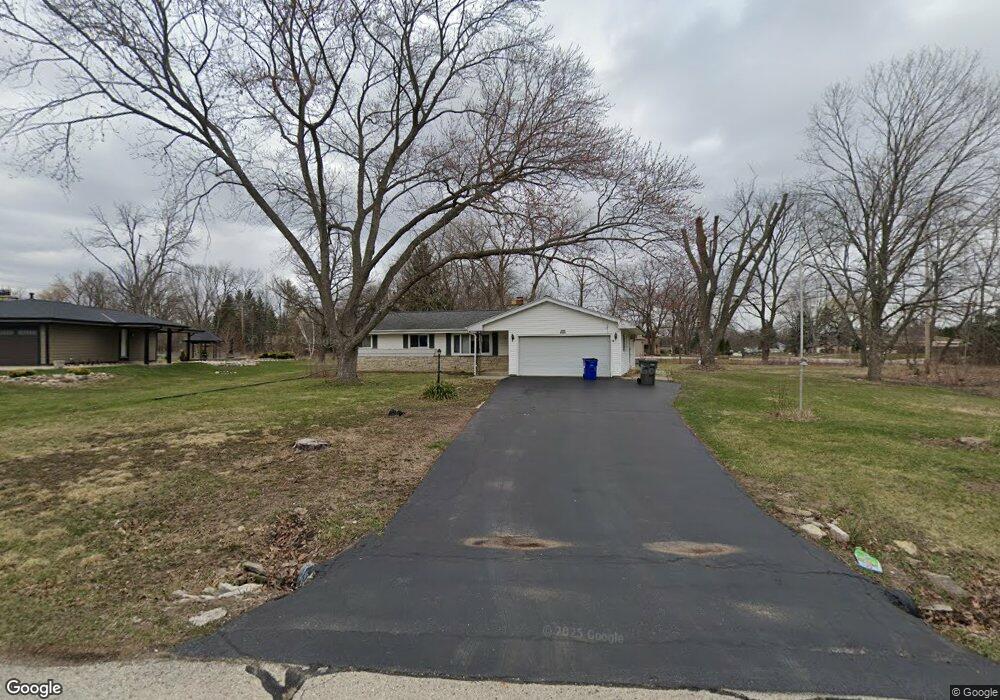
W124S6738 Jo Ct Muskego, WI 53150
Estimated Value: $383,000 - $402,137
3
Beds
2
Baths
1,250
Sq Ft
$314/Sq Ft
Est. Value
About This Home
This home is located at W124S6738 Jo Ct, Muskego, WI 53150 and is currently estimated at $392,034, approximately $313 per square foot. W124S6738 Jo Ct is a home located in Waukesha County with nearby schools including Bay Lane Elementary School, Lake Denoon Middle School, and Creative and Performing Arts.
Ownership History
Date
Name
Owned For
Owner Type
Purchase Details
Closed on
Dec 29, 2015
Sold by
Bodamer John S
Bought by
Bodamer Daniel B
Current Estimated Value
Home Financials for this Owner
Home Financials are based on the most recent Mortgage that was taken out on this home.
Original Mortgage
$86,827
Outstanding Balance
$68,965
Interest Rate
3.92%
Mortgage Type
VA
Estimated Equity
$323,069
Purchase Details
Closed on
Oct 19, 2011
Sold by
Bodamer Daniel B and Bodamer Daniel B
Bought by
Bodamer John S
Home Financials for this Owner
Home Financials are based on the most recent Mortgage that was taken out on this home.
Original Mortgage
$100,000
Interest Rate
4.02%
Mortgage Type
New Conventional
Purchase Details
Closed on
Mar 17, 2010
Sold by
Bodamer Daniel B
Bought by
Bodamer John S
Create a Home Valuation Report for This Property
The Home Valuation Report is an in-depth analysis detailing your home's value as well as a comparison with similar homes in the area
Home Values in the Area
Average Home Value in this Area
Purchase History
| Date | Buyer | Sale Price | Title Company |
|---|---|---|---|
| Bodamer Daniel B | $63,750 | None Available | |
| Bodamer John S | -- | None Available | |
| Bodamer John S | -- | None Available |
Source: Public Records
Mortgage History
| Date | Status | Borrower | Loan Amount |
|---|---|---|---|
| Open | Bodamer Daniel B | $86,827 | |
| Previous Owner | Bodamer John S | $100,000 |
Source: Public Records
Tax History Compared to Growth
Tax History
| Year | Tax Paid | Tax Assessment Tax Assessment Total Assessment is a certain percentage of the fair market value that is determined by local assessors to be the total taxable value of land and additions on the property. | Land | Improvement |
|---|---|---|---|---|
| 2024 | $2,981 | $266,000 | $75,800 | $190,200 |
| 2023 | $2,935 | $266,000 | $75,800 | $190,200 |
| 2022 | $2,872 | $266,000 | $75,800 | $190,200 |
| 2021 | $2,843 | $266,000 | $75,800 | $190,200 |
| 2020 | $3,318 | $219,100 | $66,200 | $152,900 |
| 2019 | $2,963 | $219,100 | $66,200 | $152,900 |
| 2018 | $3,000 | $219,100 | $66,200 | $152,900 |
| 2017 | $3,003 | $219,100 | $66,200 | $152,900 |
| 2016 | $3,030 | $196,800 | $63,300 | $133,500 |
| 2015 | $3,173 | $196,800 | $63,300 | $133,500 |
| 2014 | $3,458 | $196,800 | $63,300 | $133,500 |
| 2013 | $3,458 | $196,800 | $63,300 | $133,500 |
Source: Public Records
Map
Nearby Homes
- W137S6834 Dunstan Ct
- 6180 Preston Ln
- 11931 W Janesville Rd
- 11310 Haleco Ln
- Lt8 Twin Silos Ct
- W140S6982 Twin Silos Ct
- 7084 S Fieldstone Ct Unit 43
- 6749 S Prairie Wood Ln
- 6741 S Prairie Wood Ln
- 11216 Bridget Ln
- 11470 W Tess Creek St
- 11532 W Tess Creek St
- Lt17 W Old Farm Rd
- 11415 W Tess Creek St
- 5701 S 121st St
- 11388 W Tess Creek St
- 10464 W Whitnall Edge Dr Unit 203
- 11458 W Balboa St
- 13615 W Deer Park Dr
- 10939 W Coronado Ct
- W124S6726 Jo Ct
- 12362 W Larkspur Rd
- 12373 W Larkspur Rd
- S67W12480 Jo Ct
- S67W12447 Larkspur Rd
- W124S6722 Jo Ct
- 12351 W Larkspur Rd
- 12344 W Larkspur Rd
- W125S6729 Jo Ct
- W125S6733 Jo Ct
- S66W12489 Somerset Dr
- S67W12530 Larkspur Rd
- S66W12437 Somerset Dr
- S67W12477 Larkspur Rd
- S66W12515 Somerset Dr
- 12326 W Larkspur Rd
- S68W12450 Woods Rd
- 12329 W Larkspur Rd
- 12335 W Somerset Dr
- S67W12576 Larkspur Rd