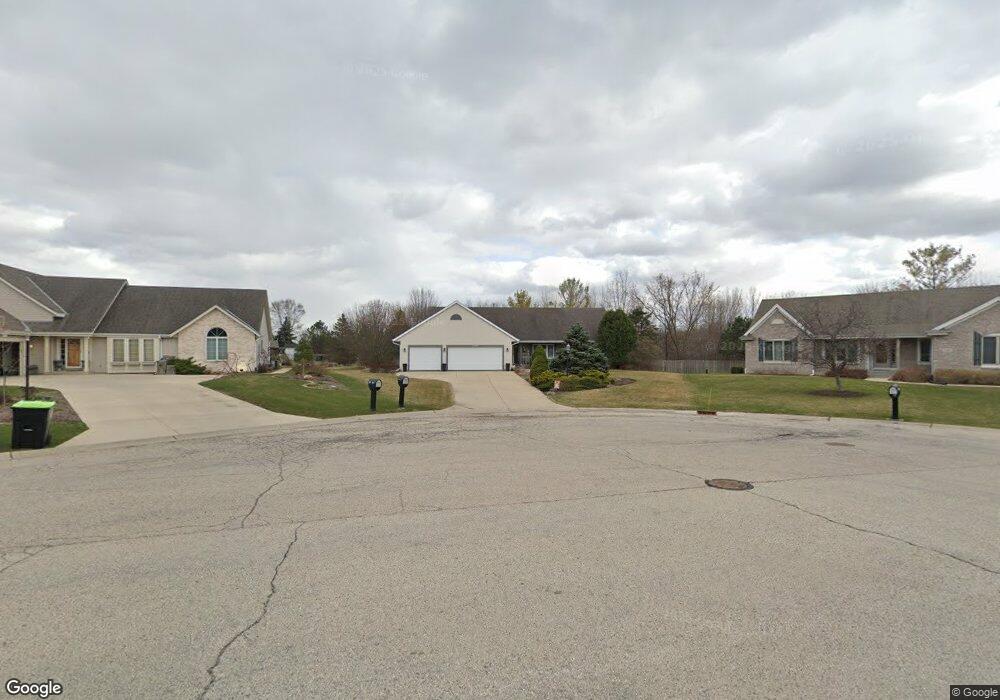
W150S7222 Westcot Dr Muskego, WI 53150
Estimated Value: $513,000 - $658,000
3
Beds
2
Baths
2,026
Sq Ft
$294/Sq Ft
Est. Value
About This Home
This home is located at W150S7222 Westcot Dr, Muskego, WI 53150 and is currently estimated at $595,210, approximately $293 per square foot. W150S7222 Westcot Dr is a home located in Waukesha County with nearby schools including Bay Lane Elementary School, Lake Denoon Middle School, and Muskego High School.
Ownership History
Date
Name
Owned For
Owner Type
Purchase Details
Closed on
Dec 12, 2001
Sold by
Bishop William J and Bishop Kim M
Bought by
Johnson Eric J and Johnson Patricia A
Current Estimated Value
Home Financials for this Owner
Home Financials are based on the most recent Mortgage that was taken out on this home.
Original Mortgage
$236,500
Outstanding Balance
$94,469
Interest Rate
6.87%
Estimated Equity
$500,741
Purchase Details
Closed on
Jun 1, 2001
Sold by
R J Mueller Enterprises Inc
Bought by
Bishop William J and Bishop Kim M
Home Financials for this Owner
Home Financials are based on the most recent Mortgage that was taken out on this home.
Original Mortgage
$198,400
Interest Rate
7.18%
Purchase Details
Closed on
Oct 4, 2000
Sold by
Rosewood Estates Inc
Bought by
R J Mueller Enterprises Inc
Home Financials for this Owner
Home Financials are based on the most recent Mortgage that was taken out on this home.
Original Mortgage
$204,000
Interest Rate
7.99%
Mortgage Type
Construction
Create a Home Valuation Report for This Property
The Home Valuation Report is an in-depth analysis detailing your home's value as well as a comparison with similar homes in the area
Home Values in the Area
Average Home Value in this Area
Purchase History
| Date | Buyer | Sale Price | Title Company |
|---|---|---|---|
| Johnson Eric J | $249,000 | -- | |
| Bishop William J | $248,000 | -- | |
| R J Mueller Enterprises Inc | $57,500 | -- |
Source: Public Records
Mortgage History
| Date | Status | Borrower | Loan Amount |
|---|---|---|---|
| Open | Johnson Eric J | $236,500 | |
| Previous Owner | Bishop William J | $198,400 | |
| Previous Owner | R J Mueller Enterprises Inc | $204,000 |
Source: Public Records
Tax History Compared to Growth
Tax History
| Year | Tax Paid | Tax Assessment Tax Assessment Total Assessment is a certain percentage of the fair market value that is determined by local assessors to be the total taxable value of land and additions on the property. | Land | Improvement |
|---|---|---|---|---|
| 2024 | $4,841 | $420,300 | $116,700 | $303,600 |
| 2023 | $4,785 | $420,300 | $116,700 | $303,600 |
| 2022 | $4,671 | $420,300 | $116,700 | $303,600 |
| 2021 | $4,633 | $420,300 | $116,700 | $303,600 |
| 2020 | $5,217 | $371,700 | $101,800 | $269,900 |
| 2019 | $5,186 | $371,700 | $101,800 | $269,900 |
| 2018 | $5,242 | $371,700 | $101,800 | $269,900 |
| 2017 | $5,218 | $371,700 | $101,800 | $269,900 |
| 2016 | $5,048 | $319,900 | $97,300 | $222,600 |
| 2015 | $5,092 | $319,900 | $97,300 | $222,600 |
| 2014 | $5,543 | $319,900 | $97,300 | $222,600 |
| 2013 | $5,543 | $319,900 | $97,300 | $222,600 |
Source: Public Records
Map
Nearby Homes
- S70W14845 Dartmouth Cir
- S70W14872 Dartmouth Cir
- W145S7644 Durham Dr
- N51W19119 Quietwood Dr
- Lt8 Twin Silos Ct
- W162S7043 Olive Cir Unit 22
- W163S7358 Bay Lane Dr
- S68W13611 Hale Park Cir
- S66W16256 Chestnut Ridge Ct
- S75W16788 Jacob Ct Unit 12
- W169S7219 Avon Ct
- W170S7361 Parkland Dr Unit 13
- Lt0 College Ave
- S78W16730 Spinnaker Dr
- Lt17 W Old Farm Rd
- W171S7452 Lannon Dr
- Lt1 College Ave
- Lt4 Lannon Dr
- S73W17268 Lake Dr
- S76W12788 Cambridge Ct E
- W150S7232 Westcot Dr
- W150S7198 Westcot Dr
- W150S7227 Westcot Dr
- S71W14949 Rosewood Dr
- W150S7191 Westcot Dr
- W150S7179 Westcot Dr
- S72W14919 Rosewood Dr
- W150S7167 Westcot Dr
- S71W14948 Rosewood Dr
- S71W14924 Rosewood Dr
- S72W14867 Rosewood Dr
- W149S7152 Rosewood Dr
- S71W14878 Rosewood Dr
- 14849 Rosewood Dr
- W150S7155 Westcot Dr
- S71W15063 Rosewood Dr
- S73W14966 Candlewood Ln
- S73W15004 Candlewood Ln
- S72W14858 Rosewood Dr
- S71W15117 Rosewood Dr