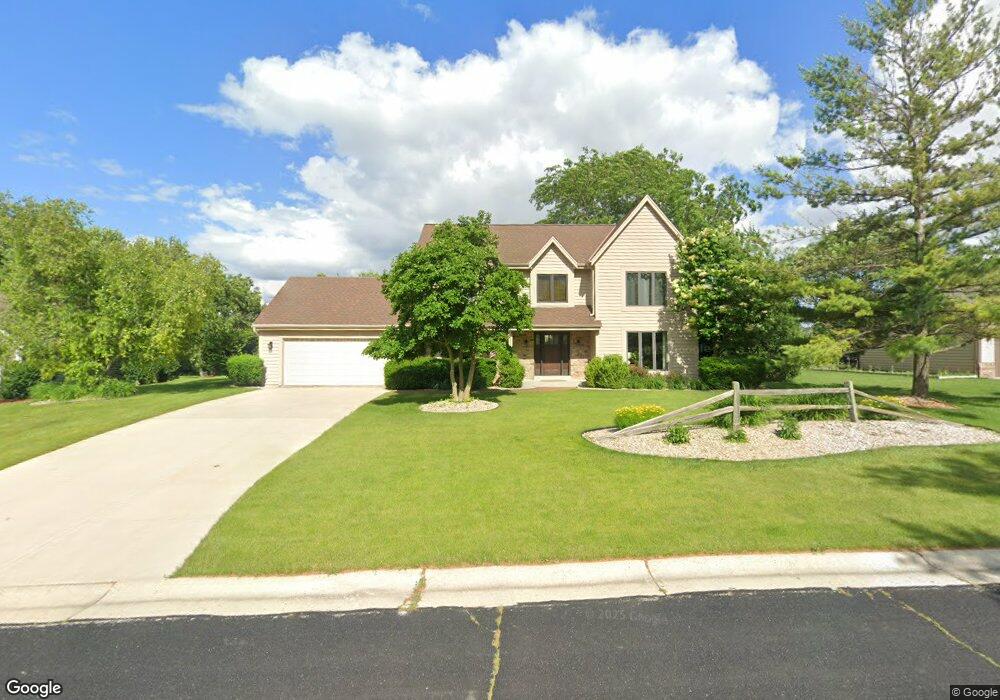
W167N5038 Grey Log Ln Menomonee Falls, WI 53051
Estimated Value: $583,000 - $605,000
3
Beds
3
Baths
2,440
Sq Ft
$245/Sq Ft
Est. Value
About This Home
This home is located at W167N5038 Grey Log Ln, Menomonee Falls, WI 53051 and is currently estimated at $596,804, approximately $244 per square foot. W167N5038 Grey Log Ln is a home located in Waukesha County with nearby schools including Marcy Elementary School, Templeton Middle School, and Hamilton High School.
Ownership History
Date
Name
Owned For
Owner Type
Purchase Details
Closed on
Mar 15, 2019
Sold by
Halcomb Jeremy S and Halcomb Amy L
Bought by
Jeremy S And Amy L Halcomb Revocable Tr
Current Estimated Value
Purchase Details
Closed on
Sep 21, 2005
Sold by
Prudential Residential Services Lp
Bought by
Halcomb Jeremy S and Halcomb Amy L
Home Financials for this Owner
Home Financials are based on the most recent Mortgage that was taken out on this home.
Original Mortgage
$279,600
Outstanding Balance
$149,869
Interest Rate
5.88%
Mortgage Type
Fannie Mae Freddie Mac
Estimated Equity
$446,935
Purchase Details
Closed on
Aug 1, 2005
Sold by
Taylor Tina K and Taylor Mark E
Bought by
Prudential Residential Services Lp and Prudential Homes Corp
Home Financials for this Owner
Home Financials are based on the most recent Mortgage that was taken out on this home.
Original Mortgage
$279,600
Outstanding Balance
$149,869
Interest Rate
5.88%
Mortgage Type
Fannie Mae Freddie Mac
Estimated Equity
$446,935
Create a Home Valuation Report for This Property
The Home Valuation Report is an in-depth analysis detailing your home's value as well as a comparison with similar homes in the area
Home Values in the Area
Average Home Value in this Area
Purchase History
| Date | Buyer | Sale Price | Title Company |
|---|---|---|---|
| Jeremy S And Amy L Halcomb Revocable Tr | -- | None Available | |
| Halcomb Jeremy S | $349,500 | -- | |
| Prudential Residential Services Lp | $349,500 | -- |
Source: Public Records
Mortgage History
| Date | Status | Borrower | Loan Amount |
|---|---|---|---|
| Open | Halcomb Jeremy S | $279,600 |
Source: Public Records
Tax History Compared to Growth
Tax History
| Year | Tax Paid | Tax Assessment Tax Assessment Total Assessment is a certain percentage of the fair market value that is determined by local assessors to be the total taxable value of land and additions on the property. | Land | Improvement |
|---|---|---|---|---|
| 2024 | $5,590 | $495,900 | $144,600 | $351,300 |
| 2023 | $5,383 | $495,900 | $144,600 | $351,300 |
| 2022 | $5,453 | $338,700 | $99,500 | $239,200 |
| 2021 | $5,135 | $338,700 | $99,500 | $239,200 |
| 2020 | $5,135 | $338,700 | $99,500 | $239,200 |
| 2019 | $4,985 | $326,600 | $99,500 | $227,100 |
| 2018 | $4,802 | $326,600 | $99,500 | $227,100 |
| 2017 | $5,360 | $326,600 | $99,500 | $227,100 |
| 2016 | $4,773 | $326,600 | $99,500 | $227,100 |
| 2015 | $5,007 | $326,600 | $99,500 | $227,100 |
| 2014 | $5,551 | $326,600 | $99,500 | $227,100 |
| 2013 | $5,551 | $326,600 | $99,500 | $227,100 |
Source: Public Records
Map
Nearby Homes
- W164N4951 Lilac Ct
- N54W16349 Westwind Dr
- 4620 N Calhoun Rd
- W170N5582 Ridgewood Dr Unit 5582
- 4685 Pilgrim Rd
- N51W18825 Quietwood Dr
- 17615 Continental Dr
- 18205 Redvere Dr
- Lt40 Edgewater Ct
- Lt43 Emerald Hills Dr
- Lt46 Emerald Hills Dr
- 4085 Brook Ln
- 4355 Continental Ct
- 18045 Continental Dr
- N51W18938 Quietwood Dr
- W188N5040 Red Crown Trail
- N59W17728 Meadow Ct Unit 15
- W144N4821 Stone Dr
- N61W16085 Hawthorne Dr
- N58W18335 Juniper Ln
- W167N5056 Grey Log Ln
- W167N5020 Grey Log Ln Unit Y
- W166N5037 Lone Oak Ln
- W166N5025 Lone Oak Ln
- W167N5021 Grey Log Ln
- W167N5070 Grey Log Ln
- N50W16669 Maple Crest Ln
- W167N5039 Grey Log Ln
- N50W16707 Maple Crest Ln
- W165N5051 Lone Oak Ln
- W167N5057 Grey Log Ln
- W167N5073 Grey Log Ln
- N50W16743 Maple Crest Ln
- W165N5059 Lone Oak Ln
- W166N4989 Lone Oak Ln
- N50W16779 Maple Crest Ln
- W165N5046 Lone Oak Ln
- N50W16564 Maple Crest Ln
- W167N5106 Grey Log Ln
- W167N5091 Grey Log Ln