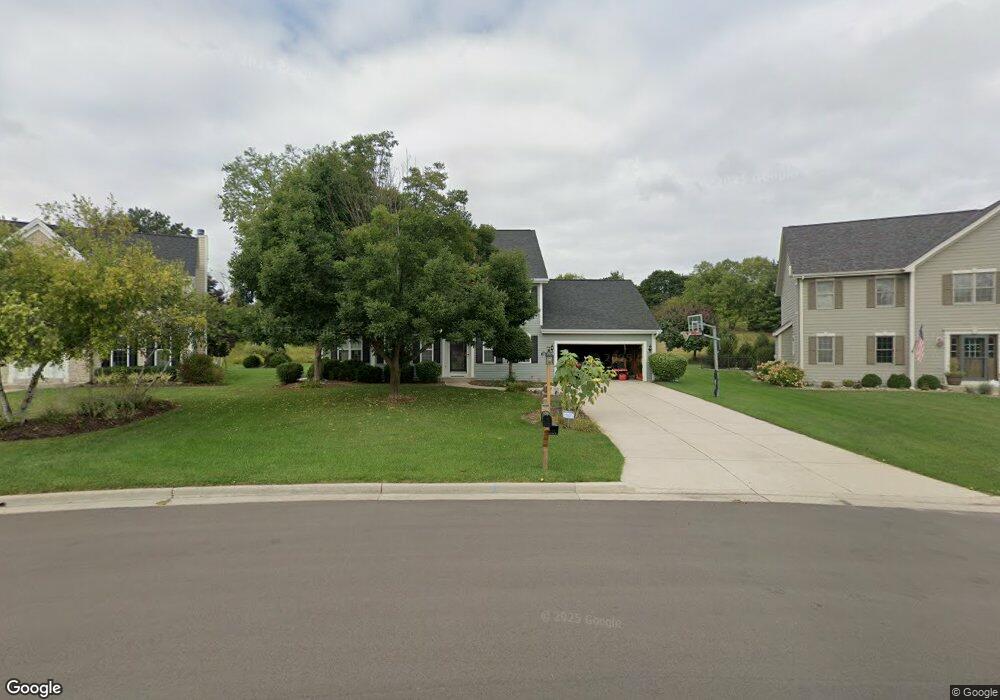
W231N7953 Martin Ct Sussex, WI 53089
Estimated Value: $633,000 - $701,000
4
Beds
4
Baths
2,478
Sq Ft
$268/Sq Ft
Est. Value
About This Home
This home is located at W231N7953 Martin Ct, Sussex, WI 53089 and is currently estimated at $663,779, approximately $267 per square foot. W231N7953 Martin Ct is a home located in Waukesha County with nearby schools including Templeton Middle School, Hamilton High School, and St. John's Lutheran School.
Ownership History
Date
Name
Owned For
Owner Type
Purchase Details
Closed on
Jun 14, 2013
Sold by
Martin Mark L and Martin Katrina F
Bought by
Dayton Brian J
Current Estimated Value
Home Financials for this Owner
Home Financials are based on the most recent Mortgage that was taken out on this home.
Original Mortgage
$300,000
Outstanding Balance
$212,831
Interest Rate
3.43%
Mortgage Type
New Conventional
Estimated Equity
$450,948
Purchase Details
Closed on
Oct 15, 2009
Sold by
Martin Mark L and Martin Katrina F
Bought by
Mark L & Katrina F Martin Revocable Trus
Purchase Details
Closed on
Apr 25, 2005
Sold by
Sandri Joseph S and Slominski Michelle M
Bought by
Martin Mark L and Martin Katrina F
Home Financials for this Owner
Home Financials are based on the most recent Mortgage that was taken out on this home.
Original Mortgage
$288,000
Interest Rate
5.25%
Mortgage Type
Purchase Money Mortgage
Create a Home Valuation Report for This Property
The Home Valuation Report is an in-depth analysis detailing your home's value as well as a comparison with similar homes in the area
Home Values in the Area
Average Home Value in this Area
Purchase History
| Date | Buyer | Sale Price | Title Company |
|---|---|---|---|
| Dayton Brian J | $375,000 | None Available | |
| Mark L & Katrina F Martin Revocable Trus | -- | None Available | |
| Martin Mark L | $360,000 | -- |
Source: Public Records
Mortgage History
| Date | Status | Borrower | Loan Amount |
|---|---|---|---|
| Open | Dayton Brian J | $300,000 | |
| Previous Owner | Martin Mark L | $288,000 | |
| Closed | Martin Mark L | $72,000 |
Source: Public Records
Tax History Compared to Growth
Tax History
| Year | Tax Paid | Tax Assessment Tax Assessment Total Assessment is a certain percentage of the fair market value that is determined by local assessors to be the total taxable value of land and additions on the property. | Land | Improvement |
|---|---|---|---|---|
| 2024 | $7,223 | $593,700 | $108,500 | $485,200 |
| 2023 | $6,461 | $518,400 | $108,500 | $409,900 |
| 2022 | $6,652 | $474,900 | $102,000 | $372,900 |
| 2021 | $7,064 | $445,000 | $102,000 | $343,000 |
| 2020 | $6,224 | $413,500 | $102,000 | $311,500 |
| 2019 | $6,308 | $403,500 | $97,000 | $306,500 |
| 2018 | $6,041 | $392,900 | $86,400 | $306,500 |
| 2017 | $6,526 | $387,700 | $86,400 | $301,300 |
| 2016 | $5,894 | $378,700 | $86,400 | $292,300 |
| 2015 | $6,002 | $378,700 | $86,400 | $292,300 |
| 2014 | $5,705 | $375,000 | $86,400 | $288,600 |
| 2013 | $5,705 | $340,400 | $86,400 | $254,000 |
Source: Public Records
Map
Nearby Homes
- Lt25 Five Iron Way
- W234N7641 Grey Moss Ct
- N82W23452 Five Iron Way
- W226N8107 Longview Dr
- W233N7504 Highview Dr
- W279N6010 Serenity Dr
- W241N7522 N Woodsview Dr
- W222N8208 Plainview Pkwy
- W227N8720 Tamarack Rd
- W238N7214 Michele Ln
- W243N7650 Hilltop Ct
- W233N6997 Salem Dr
- W247N7543 Overland Rd
- N75W22109 Cherry Hill Rd
- N66W25514 Beaver Creek Ln
- W225N8982 Jolyn Dr
- n75w Overland Ct
- W220N7095 Town Line St
- N67W23470 Linda Dr
- W248N7504 Beverly Ln
- W231N7957 Martin Ct
- W231N7933 Martin Ct
- W231N7961 Martin Ct
- W231N7936 Martin Ct
- W231N7921 Martin Ct
- W231N7965 Martin Ct
- W232N7942 Nesting Ct
- W231N7946 Martin Ct
- W232N7954 Nesting Ct
- W232N7930 Nesting Ct
- W231N7909 Martin Ct
- W231N7916 Martin Ct
- W231N7969 Martin Ct
- W232N7918 Nesting Ct
- W232N7958 Nesting Ct
- W231N7948 Martin Ct
- W231N7902 Martin Ct
- W232N7906 Nesting Ct
- W231N7960 Martin Ct
- W231N7895 Martin Ct