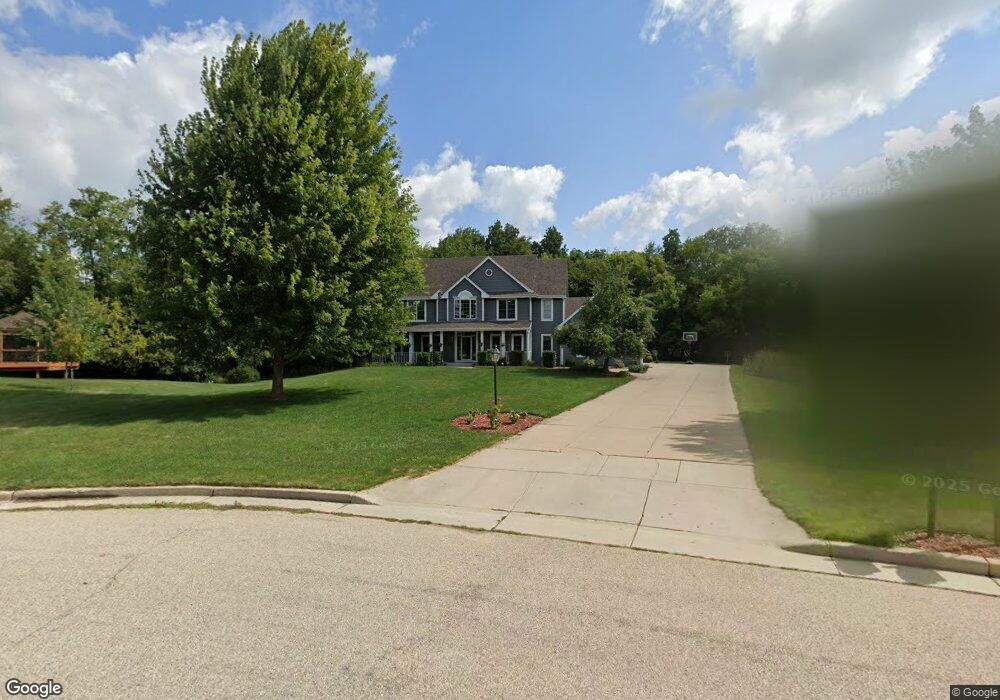
W237N7372 Monterey Ct Sussex, WI 53089
Estimated Value: $716,000 - $823,000
4
Beds
3
Baths
3,397
Sq Ft
$224/Sq Ft
Est. Value
About This Home
This home is located at W237N7372 Monterey Ct, Sussex, WI 53089 and is currently estimated at $760,862, approximately $223 per square foot. W237N7372 Monterey Ct is a home located in Waukesha County with nearby schools including Templeton Middle School, Hamilton High School, and St. John's Lutheran School.
Ownership History
Date
Name
Owned For
Owner Type
Purchase Details
Closed on
Aug 28, 2020
Sold by
Richter Melissa E and Dieck Sheri A
Bought by
Panno Brett Allan and Panno Amy Kristin
Current Estimated Value
Purchase Details
Closed on
Aug 26, 2015
Sold by
Rajchel Donald J and Rajchel Jill K
Bought by
Richter Melissa E and Dieick Sheri A
Home Financials for this Owner
Home Financials are based on the most recent Mortgage that was taken out on this home.
Original Mortgage
$361,600
Interest Rate
3.25%
Mortgage Type
Adjustable Rate Mortgage/ARM
Purchase Details
Closed on
Jan 21, 2004
Sold by
Westaire Inc
Bought by
Rajchel Donald J and Rajchel Jill K
Home Financials for this Owner
Home Financials are based on the most recent Mortgage that was taken out on this home.
Original Mortgage
$318,500
Interest Rate
5.5%
Mortgage Type
Construction
Create a Home Valuation Report for This Property
The Home Valuation Report is an in-depth analysis detailing your home's value as well as a comparison with similar homes in the area
Home Values in the Area
Average Home Value in this Area
Purchase History
| Date | Buyer | Sale Price | Title Company |
|---|---|---|---|
| Panno Brett Allan | $530,000 | None Available | |
| Richter Melissa E | $452,000 | None Available | |
| Rajchel Donald J | $110,000 | -- |
Source: Public Records
Mortgage History
| Date | Status | Borrower | Loan Amount |
|---|---|---|---|
| Previous Owner | Richter Melissa E | $361,600 | |
| Previous Owner | Rajchel Donald J | $318,500 |
Source: Public Records
Tax History Compared to Growth
Tax History
| Year | Tax Paid | Tax Assessment Tax Assessment Total Assessment is a certain percentage of the fair market value that is determined by local assessors to be the total taxable value of land and additions on the property. | Land | Improvement |
|---|---|---|---|---|
| 2024 | $7,321 | $601,700 | $130,500 | $471,200 |
| 2023 | $7,400 | $592,400 | $130,500 | $461,900 |
| 2022 | $7,447 | $530,700 | $123,000 | $407,700 |
| 2021 | $7,251 | $510,000 | $123,000 | $387,000 |
| 2020 | $6,862 | $455,500 | $123,000 | $332,500 |
| 2019 | $7,170 | $453,500 | $123,000 | $330,500 |
| 2018 | $6,874 | $446,400 | $115,900 | $330,500 |
| 2017 | $7,307 | $434,100 | $115,900 | $318,200 |
| 2016 | $6,550 | $420,500 | $115,900 | $304,600 |
| 2015 | $6,671 | $420,500 | $115,900 | $304,600 |
| 2014 | $6,586 | $412,200 | $115,900 | $296,300 |
| 2013 | $6,586 | $391,400 | $115,900 | $275,500 |
Source: Public Records
Map
Nearby Homes
- W238N7214 Michele Ln
- W233N7504 Highview Dr
- W247N7543 Overland Rd
- W243N7650 Hilltop Ct
- W233N6997 Salem Dr
- Lt0 Maple Ave
- Lt25 Five Iron Way
- N71W24818 Wildwood Way
- N82W23452 Five Iron Way
- N76W24944 Ridgefield Dr
- N63W23954 Terrace Dr
- N66W25720 Big Sky Dr
- N63w23524 Silver Spring Dr
- W279N6010 Serenity Dr
- W226N8107 Longview Dr
- N75W22109 Cherry Hill Rd
- W220N7095 Town Line St
- W220N7920 Golf View Ln
- N67W25396 Vail Ln
- W222N8208 Plainview Pkwy
- W237N7364 Monterey Ct
- W237N7376 Monterey Ct
- W237N7350 Monterey Ct
- W238N7381 Monterey Ct
- N74W23815 Overland Ct
- W238N7351 Monterey Ct
- N72W23762 Craven Dr
- W238N7375 Monterey Ct
- W238N7359 Monterey Ct
- N72W23820 Craven Dr
- W238N7367 Monterey Ct
- N72W23838 Craven Dr
- N73W23866 Craven Dr
- N72W23781 Craven Dr
- N72W23763 Craven Dr
- N74W23873 Overland Ct
- W239N7344 Charles Ct
- N73W23623 Craven Dr
- N72W23805 Craven Dr
- W239N7358 Charles Ct