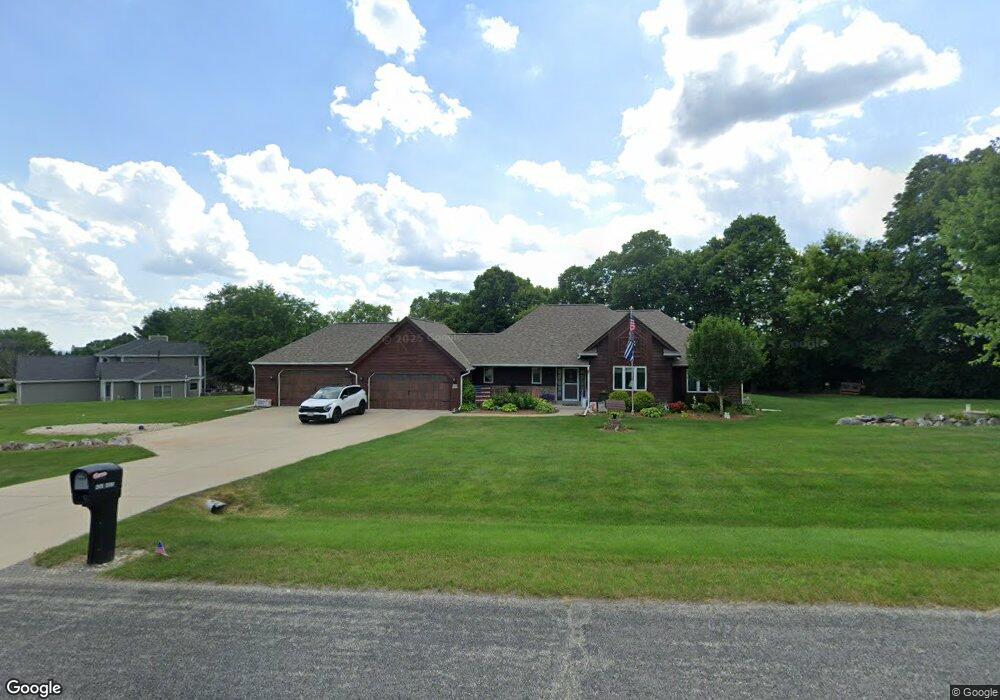
W260N5515 Glen Ridge Rd Sussex, WI 53089
Estimated Value: $496,065 - $796,000
--
Bed
--
Bath
--
Sq Ft
0.88
Acres
About This Home
This home is located at W260N5515 Glen Ridge Rd, Sussex, WI 53089 and is currently estimated at $663,266. W260N5515 Glen Ridge Rd is a home located in Waukesha County with nearby schools including Richmond School District and Arrowhead High School.
Ownership History
Date
Name
Owned For
Owner Type
Purchase Details
Closed on
Jul 28, 2000
Sold by
The Cardinal Development Group Inc
Bought by
Retzlaff David N and Retzlaff Tammy S
Current Estimated Value
Home Financials for this Owner
Home Financials are based on the most recent Mortgage that was taken out on this home.
Original Mortgage
$220,800
Outstanding Balance
$80,172
Interest Rate
8.24%
Mortgage Type
Purchase Money Mortgage
Estimated Equity
$583,094
Purchase Details
Closed on
Aug 30, 1999
Sold by
Mccormick Elaine M
Bought by
Cardinal Development Group Inc
Home Financials for this Owner
Home Financials are based on the most recent Mortgage that was taken out on this home.
Original Mortgage
$174,000
Interest Rate
7.77%
Mortgage Type
Purchase Money Mortgage
Create a Home Valuation Report for This Property
The Home Valuation Report is an in-depth analysis detailing your home's value as well as a comparison with similar homes in the area
Home Values in the Area
Average Home Value in this Area
Purchase History
| Date | Buyer | Sale Price | Title Company |
|---|---|---|---|
| Retzlaff David N | $276,000 | -- | |
| Cardinal Development Group Inc | $40,500 | -- |
Source: Public Records
Mortgage History
| Date | Status | Borrower | Loan Amount |
|---|---|---|---|
| Open | Retzlaff David N | $220,800 | |
| Previous Owner | Cardinal Development Group Inc | $174,000 | |
| Closed | Cardinal Development Group Inc | $40,500 |
Source: Public Records
Tax History Compared to Growth
Tax History
| Year | Tax Paid | Tax Assessment Tax Assessment Total Assessment is a certain percentage of the fair market value that is determined by local assessors to be the total taxable value of land and additions on the property. | Land | Improvement |
|---|---|---|---|---|
| 2024 | $4,109 | $376,800 | $73,200 | $303,600 |
| 2023 | $4,040 | $376,800 | $73,200 | $303,600 |
| 2022 | $4,289 | $376,800 | $73,200 | $303,600 |
| 2021 | $4,200 | $376,800 | $73,200 | $303,600 |
| 2020 | $4,468 | $303,600 | $64,000 | $239,600 |
| 2019 | $4,735 | $303,600 | $64,000 | $239,600 |
| 2018 | $4,807 | $303,600 | $64,000 | $239,600 |
| 2017 | $5,005 | $303,600 | $64,000 | $239,600 |
| 2016 | $5,267 | $303,600 | $64,000 | $239,600 |
| 2015 | $4,857 | $303,600 | $64,000 | $239,600 |
| 2014 | $5,105 | $303,600 | $64,000 | $239,600 |
| 2013 | $5,105 | $303,600 | $64,000 | $239,600 |
Source: Public Records
Map
Nearby Homes
- W259N5743 Apple Cider Ct
- Lt28 Apple Cider Ct
- N58W26468 Mount Du Lac Dr
- W258N5755 Vista Ct
- Kingston Signature Plan at October Fields
- McKinley IV Plan at Golden Fields
- Wilshire II Plan at October Fields
- Richmond Plan at Golden Fields
- Riley II Plan at Golden Fields
- Pinewood Ranch Plan at October Fields
- Kingston Signature Plan at Golden Fields
- Hampton Bay Plan at October Fields
- Wilshire Manor III Plan at October Fields
- Prairiefield Courtyard Plan at October Fields
- Rochester Plan at October Fields
- The Juneberry Plan at October Fields
- The Bradford Plan at Vista Run - The Villas at Vista Run
- Norwood Plan at Golden Fields
- Savannah Plan at October Fields
- Wilshire Manor III Plan at Golden Fields
- W260N5477 Glen Ridge Rd
- N54W26140 Boden Ln
- W260N5532 Glen Ridge Rd
- W260N5516 Glen Ridge Rd
- W260N5500 Glen Ridge Rd
- N54W26176 Boden Ln
- W261N5551 Glen Ridge Rd
- N54W26093 Boden Ln
- W260N5580 Glen Ridge Rd
- W260N5454 Glen Ridge Rd
- W262N5484 Boden Ln
- N54W26153 Boden Ln
- N54W26010 Glen Ridge Ct
- W260N5417 Glen Ridge Rd
- W262N5550 Boden Ln
- N55W26073 Richmond Rd
- W262N5558 Boden Ln
- N54W26181 Boden Ln
- N54W25978 Glen Ridge Ct
- N54W26049 Glen Ridge Ct