L
Seller's Agent in 2018
LISTING MAINTENANCE
Century 21 Ace Realty
Estimated Value: $357,704 - $396,000
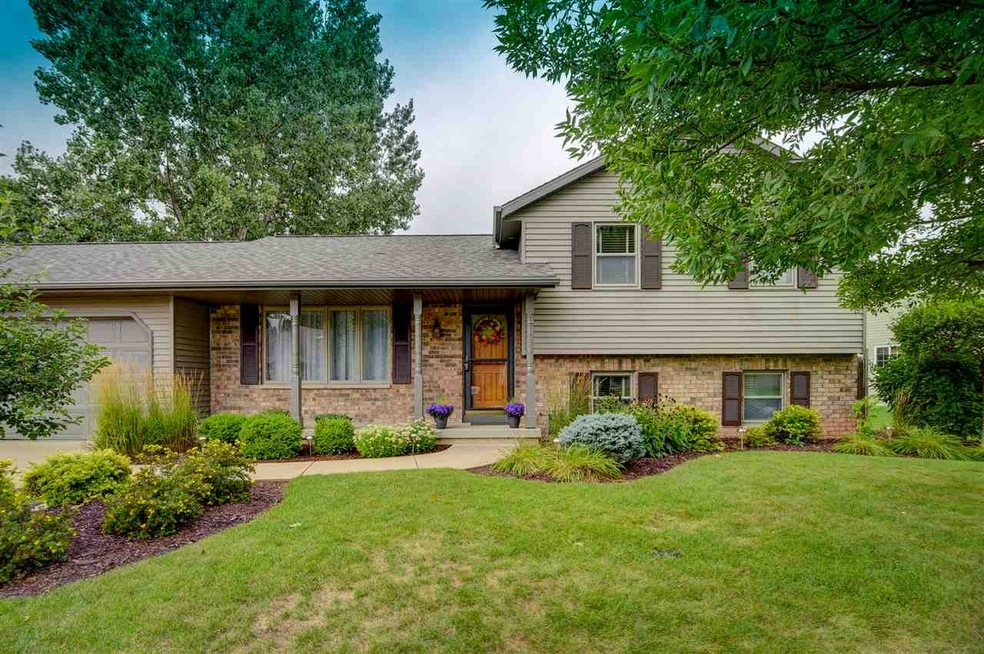
Hard to find 3 bedroom, 2 full bath, 3 car garage in Kimberly Schools. Seller just installed a new roof last week, and so much more. You will love the 2 living spaces that this home features. 3 Large bedrooms and still a LL for storage. Fenced in back yard large two tiered deck with build in swing. All showing start on Thursday 8-30
Last Agent to Sell the Property
LISTING MAINTENANCE
Century 21 Ace Realty Listed on: 08/20/2018
Last Buyer's Agent
Joshua Oehlke
Rieckmann Real Estate Group, Inc License #94-85175
| Date | Buyer | Sale Price | Title Company |
|---|---|---|---|
| Wilfuer Matthew | $219,900 | -- | |
| Klein Phillip J | $151,000 | -- |
| Date | Event | Price | List to Sale | Price per Sq Ft |
|---|---|---|---|---|
| 11/05/2018 11/05/18 | Sold | $219,900 | 0.0% | $136 / Sq Ft |
| 11/05/2018 11/05/18 | Pending | -- | -- | -- |
| 08/20/2018 08/20/18 | For Sale | $219,900 | -- | $136 / Sq Ft |
| Year | Tax Paid | Tax Assessment Tax Assessment Total Assessment is a certain percentage of the fair market value that is determined by local assessors to be the total taxable value of land and additions on the property. | Land | Improvement |
|---|---|---|---|---|
| 2024 | $3,757 | $340,600 | $39,900 | $300,700 |
| 2023 | $3,489 | $309,600 | $39,900 | $269,700 |
| 2022 | $3,334 | $275,100 | $39,900 | $235,200 |
| 2021 | $3,668 | $256,500 | $30,700 | $225,800 |
| 2020 | $3,854 | $238,200 | $30,700 | $207,500 |
| 2019 | $3,610 | $219,900 | $30,700 | $189,200 |
| 2018 | $2,782 | $170,100 | $30,700 | $139,400 |
| 2017 | $2,670 | $152,500 | $27,000 | $125,500 |
| 2016 | $2,807 | $152,500 | $27,000 | $125,500 |
| 2015 | $2,764 | $152,500 | $27,000 | $125,500 |
| 2014 | $2,807 | $152,500 | $27,000 | $125,500 |
| 2013 | $2,795 | $152,500 | $27,000 | $125,500 |
L
Seller's Agent in 2018
LISTING MAINTENANCE
Century 21 Ace Realty
J
Buyer's Agent in 2018
Joshua Oehlke
Rieckmann Real Estate Group, Inc
Source: REALTORS® Association of Northeast Wisconsin
MLS Number: 50190114
APN: 03-0-1497-00
Disclaimer: Certain information contained herein is derived from information provided by parties other than Homes.com. All information provided is deemed reliable, but is not guaranteed to be accurate and should be independently verified.
![]() Based on information submitted to the MLS GRID. All data is obtained from various sources and may not have been verified by broker or MLS GRID. Supplied Open House Information is subject to change without notice. All information should be independently reviewed and verified for accuracy. Properties may or may not be listed by the office/agent presenting the information. Some IDX listings have been excluded from this website. Copyright REALTORS Association of Northeast Wisconsin MLS, Inc. - All Rights Reserved
Based on information submitted to the MLS GRID. All data is obtained from various sources and may not have been verified by broker or MLS GRID. Supplied Open House Information is subject to change without notice. All information should be independently reviewed and verified for accuracy. Properties may or may not be listed by the office/agent presenting the information. Some IDX listings have been excluded from this website. Copyright REALTORS Association of Northeast Wisconsin MLS, Inc. - All Rights Reserved
Information received from other 3rd parties: All information deemed reliable but not guaranteed and should be independently verified. All properties are subject to prior sale, change, or withdrawal. Neither listing broker nor Ten-X nor RANW MLS shall be responsible for any typographical errors, misinformation, misprints, and shall be held totally harmless.
IDX information is provided exclusively for consumers’ personal, non-commercial use, that it may not be used for any purpose other than to identify prospective properties consumers may be interested in purchasing, and that the data is deemed reliable but is not guaranteed accurate by the MLS.
Based on information submitted to the MLS GRID
Ask me questions while you tour the home.