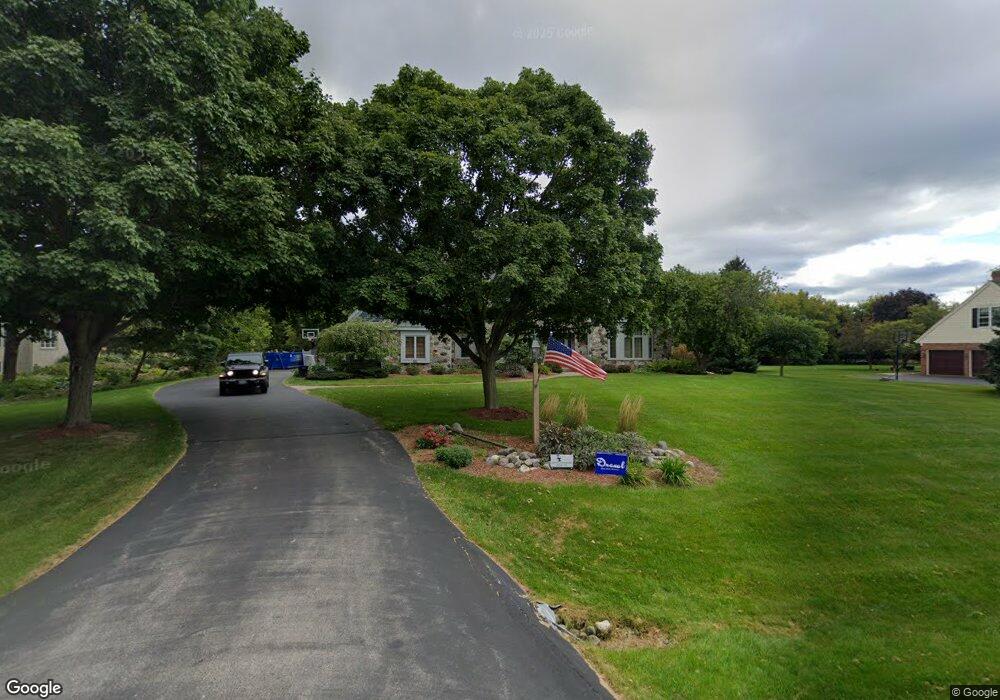
W301N3096 Windrush Cir Pewaukee, WI 53072
Estimated Value: $821,014 - $1,034,000
Studio
--
Bath
--
Sq Ft
40,075
Sq Ft Lot
About This Home
This home is located at W301N3096 Windrush Cir, Pewaukee, WI 53072 and is currently estimated at $967,504. W301N3096 Windrush Cir is a home located in Waukesha County with nearby schools including Arrowhead High School, St Charles Parish School, and Zion Lutheran School.
Ownership History
Date
Name
Owned For
Owner Type
Purchase Details
Closed on
Aug 16, 2012
Sold by
Hartzog Gregory J and Hartzog Diane L
Bought by
Vento James R and Vento Kristen A
Current Estimated Value
Home Financials for this Owner
Home Financials are based on the most recent Mortgage that was taken out on this home.
Original Mortgage
$466,850
Outstanding Balance
$334,160
Interest Rate
4.62%
Mortgage Type
New Conventional
Estimated Equity
$633,344
Purchase Details
Closed on
Jun 30, 1999
Sold by
Treichel Jeffrey S and Treichel Patricia L
Bought by
Hartzog Gregory J and Hartzog Diane L
Home Financials for this Owner
Home Financials are based on the most recent Mortgage that was taken out on this home.
Original Mortgage
$369,600
Interest Rate
6.75%
Create a Home Valuation Report for This Property
The Home Valuation Report is an in-depth analysis detailing your home's value as well as a comparison with similar homes in the area
Home Values in the Area
Average Home Value in this Area
Purchase History
| Date | Buyer | Sale Price | Title Company |
|---|---|---|---|
| Vento James R | $475,000 | None Available | |
| Hartzog Gregory J | $462,000 | -- |
Source: Public Records
Mortgage History
| Date | Status | Borrower | Loan Amount |
|---|---|---|---|
| Open | Vento James R | $466,850 | |
| Previous Owner | Hartzog Gregory J | $369,600 |
Source: Public Records
Tax History
| Year | Tax Paid | Tax Assessment Tax Assessment Total Assessment is a certain percentage of the fair market value that is determined by local assessors to be the total taxable value of land and additions on the property. | Land | Improvement |
|---|---|---|---|---|
| 2024 | $5,417 | $500,000 | $125,000 | $375,000 |
| 2023 | $5,262 | $500,000 | $125,000 | $375,000 |
| 2022 | $5,176 | $500,000 | $125,000 | $375,000 |
| 2021 | $5,160 | $500,000 | $125,000 | $375,000 |
| 2020 | $5,228 | $500,000 | $125,000 | $375,000 |
| 2019 | $5,269 | $500,000 | $125,000 | $375,000 |
| 2018 | $5,590 | $500,000 | $125,000 | $375,000 |
| 2017 | $6,126 | $523,000 | $125,000 | $398,000 |
| 2016 | $6,199 | $474,000 | $125,000 | $349,000 |
| 2015 | $6,659 | $474,000 | $125,000 | $349,000 |
| 2014 | $7,638 | $564,000 | $125,000 | $439,000 |
| 2013 | $7,638 | $564,000 | $125,000 | $439,000 |
Source: Public Records
Map
Nearby Homes
- W305N2808 Foxwood Ct
- 1019 Wellington Way
- W304N2426 Maple Ave
- N24W30375 Crystal Springs Dr
- 650 Dundee Ln Unit F
- W292N3296 Summerhill Rd
- 581 Hartridge Dr Unit 1
- N35W28682 Old North Shore Dr
- N17W29610 Caldicot North Cir
- N17W29663 Caldicot North Cir
- Lt16 Lakeside Ridge Ct
- 476 Oak Ridge Dr Unit 3
- 445 Sunset Trail Unit 113
- W292N4254 Prairie Wind Cir N
- N20W28482 Oakton Rd
- 208 Highland Ave
- 4835 Easy St Unit 9
- 4887 Easy St Unit 11
- 2293A Circle Ridge Unit 31
- W290N4646 Cold Water Creek
- W301N3108 Windrush Cir
- W301N3066 Windrush Cir
- W301N3048 Windrush Cir
- W301N3128 Windrush Cir
- W300N3099 Maple Ave
- W300N3109 Maple Ave
- W301N3018 Windrush Cir
- W301N3150 Windrush Cir
- W300N3045 Maple Ave
- W300N3129 Maple Ave
- W301N3176 Windrush Cir
- W302N3057 Windrush Cir
- W302N3117 Windrush Cir
- W299N3058 Maple Ave
- N31W29955 Franciscan Rd
- W301N3198 Windrush Cir
- W302N2997 Windrush Cir
- W299N2990 Maple Ave
- N30W30252 Great Hill Ct
- W302N3129 Timber Hill Ct
Your Personal Tour Guide
Ask me questions while you tour the home.