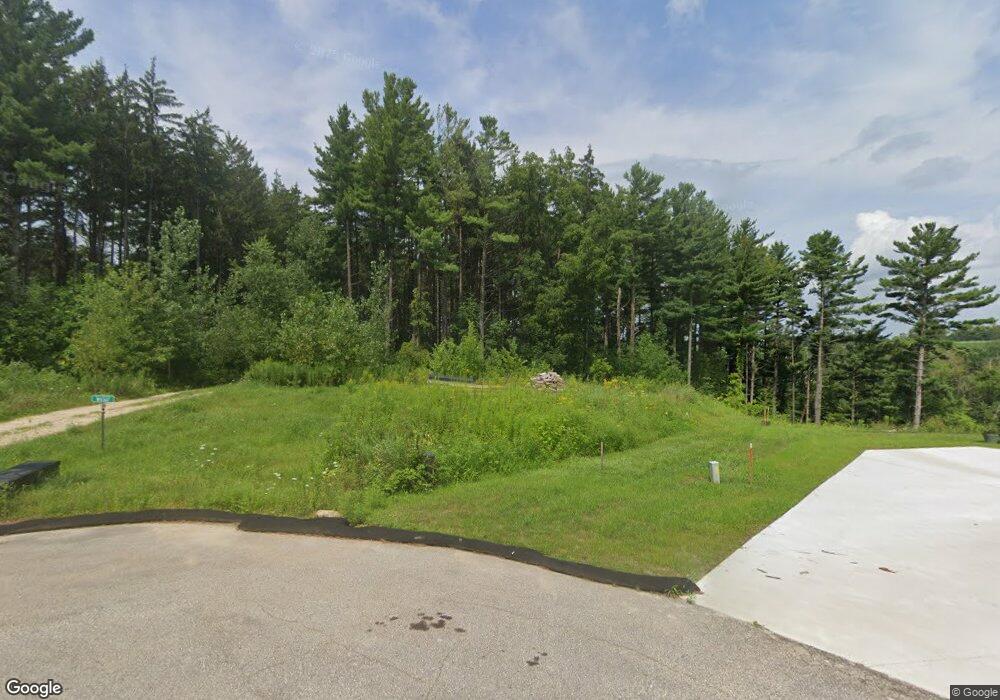
W4367 Shady Pines Rd La Crosse, WI 54601
Estimated Value: $322,000 - $558,000
--
Bed
--
Bath
--
Sq Ft
2.84
Acres
About This Home
This home is located at W4367 Shady Pines Rd, La Crosse, WI 54601 and is currently estimated at $463,496. W4367 Shady Pines Rd is a home with nearby schools including West Salem Elementary School, West Salem Middle School, and West Salem High School.
Ownership History
Date
Name
Owned For
Owner Type
Purchase Details
Closed on
Nov 18, 2016
Sold by
Stratman Jordan and Stratman Trisha Stratman
Bought by
Wacker Chad L
Current Estimated Value
Home Financials for this Owner
Home Financials are based on the most recent Mortgage that was taken out on this home.
Original Mortgage
$30,600
Outstanding Balance
$24,961
Interest Rate
3.94%
Estimated Equity
$438,535
Purchase Details
Closed on
Jun 14, 2010
Sold by
Cool Valley Llc
Bought by
Stratman Jordan and Stratman Trisha
Home Financials for this Owner
Home Financials are based on the most recent Mortgage that was taken out on this home.
Original Mortgage
$31,500
Interest Rate
4.86%
Mortgage Type
Purchase Money Mortgage
Purchase Details
Closed on
Sep 7, 2006
Sold by
Centurytel Of Wisconsin Llc
Bought by
Department Of Transportation
Purchase Details
Closed on
Nov 28, 2005
Sold by
Cool Valley Llc
Bought by
Department Of Transportation
Create a Home Valuation Report for This Property
The Home Valuation Report is an in-depth analysis detailing your home's value as well as a comparison with similar homes in the area
Home Values in the Area
Average Home Value in this Area
Purchase History
| Date | Buyer | Sale Price | Title Company |
|---|---|---|---|
| Wacker Chad L | $10,200 | -- | |
| Stratman Jordan | $35,000 | None Available | |
| Department Of Transportation | -- | None Available | |
| Department Of Transportation | $4,700 | None Available |
Source: Public Records
Mortgage History
| Date | Status | Borrower | Loan Amount |
|---|---|---|---|
| Open | Wacker Chad L | $30,600 | |
| Closed | Wacker Chad L | -- | |
| Previous Owner | Stratman Jordan | $31,500 |
Source: Public Records
Tax History Compared to Growth
Tax History
| Year | Tax Paid | Tax Assessment Tax Assessment Total Assessment is a certain percentage of the fair market value that is determined by local assessors to be the total taxable value of land and additions on the property. | Land | Improvement |
|---|---|---|---|---|
| 2023 | $4,635 | $327,400 | $58,900 | $268,500 |
| 2022 | $4,300 | $327,400 | $58,900 | $268,500 |
| 2021 | $4,255 | $327,400 | $58,900 | $268,500 |
| 2020 | $4,313 | $226,000 | $29,000 | $197,000 |
| 2019 | $3,948 | $226,000 | $29,000 | $197,000 |
| 2018 | $3,742 | $226,000 | $29,000 | $197,000 |
| 2017 | $3,535 | $226,000 | $29,000 | $197,000 |
| 2016 | $506 | $29,000 | $29,000 | $0 |
| 2015 | $513 | $29,000 | $29,000 | $0 |
| 2014 | $440 | $25,700 | $25,700 | $0 |
| 2013 | $472 | $25,700 | $25,700 | $0 |
Source: Public Records
Map
Nearby Homes
- N1947 Forest Ridge Dr
- N2031 County Road F -
- W4936 Battlestone Station Rd
- W4946 Battlestone Station Rd Unit 23
- W4952 Battlestone Station Rd Unit 25
- N1583 Meadow Ridge Rd
- N1175 Breidel Coulee Rd
- N1394 Red Oaks Dr
- W4861 Harvest Ln
- W4945 Harvest Ln
- W4934 Mill St
- 000 Us Highway 14 61 -
- N2015 Stonecrest Rd
- W5285 County Road F
- W5419 Pine Bluff Rd
- W5453 Pine Bluff Rd
- N1110 Bloomer Mill Rd
- W5522 Eagle Point Dr
- W4051 Twin Creeks Rd
- W4844 State Road 33
- W4358 Shady Pines Rd
- 0 Shady Pines Rd Unit LOT 8
- W4350 Shady Pines Rd
- W4361 State Road 33
- W4346 Shady Pines Rd
- W4333 State Road 33
- W4494 State Road 33
- W4325 Wisconsin 33
- W4325 State Road 33
- W4339 State Road 33
- W4491 State Road 33
- W4256 State Road 33
- W4246 State Road 33
- W4535 State Road 33
- W4240 State Road 33
- W4317 State Road 33
- W4309 State Road 33
- W4185 State Road 33
- N1776 Breidel Coulee Rd
- W4123 State Road 33