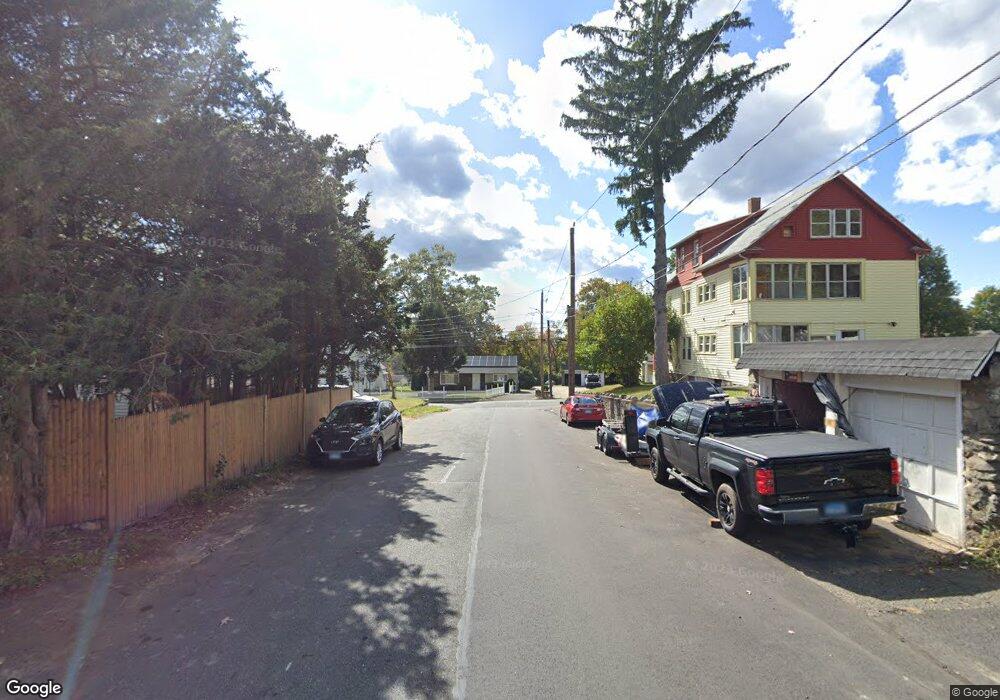
Whittlesey Ave Waterbury, CT 06701
South End District NeighborhoodEstimated Value: $313,000 - $385,000
6
Beds
3
Baths
2,500
Sq Ft
$144/Sq Ft
Est. Value
About This Home
This home is located at Whittlesey Ave, Waterbury, CT 06701 and is currently estimated at $360,000, approximately $144 per square foot. Whittlesey Ave is a home located in New Haven County with nearby schools including John G. Gilmartin Elementary School, Crosby High School, and St Peter & Paul School.
Ownership History
Date
Name
Owned For
Owner Type
Purchase Details
Closed on
May 7, 2018
Sold by
M & S Investment Llc
Bought by
Sef Llc
Current Estimated Value
Home Financials for this Owner
Home Financials are based on the most recent Mortgage that was taken out on this home.
Original Mortgage
$98,250
Outstanding Balance
$8,476
Interest Rate
4.45%
Mortgage Type
New Conventional
Estimated Equity
$351,524
Purchase Details
Closed on
Nov 23, 2010
Sold by
Mcnamara Apartments Ll
Bought by
M & S Investments Llc
Create a Home Valuation Report for This Property
The Home Valuation Report is an in-depth analysis detailing your home's value as well as a comparison with similar homes in the area
Home Values in the Area
Average Home Value in this Area
Purchase History
| Date | Buyer | Sale Price | Title Company |
|---|---|---|---|
| Sef Llc | $131,000 | -- | |
| M & S Investments Llc | $35,000 | -- |
Source: Public Records
Mortgage History
| Date | Status | Borrower | Loan Amount |
|---|---|---|---|
| Open | M & S Investments Llc | $98,250 |
Source: Public Records
Tax History Compared to Growth
Tax History
| Year | Tax Paid | Tax Assessment Tax Assessment Total Assessment is a certain percentage of the fair market value that is determined by local assessors to be the total taxable value of land and additions on the property. | Land | Improvement |
|---|---|---|---|---|
| 2025 | $6,524 | $145,040 | $15,750 | $129,290 |
| 2024 | $7,171 | $145,040 | $15,750 | $129,290 |
| 2023 | $7,860 | $145,040 | $15,750 | $129,290 |
| 2022 | $4,447 | $73,850 | $15,750 | $58,100 |
| 2021 | $4,447 | $73,850 | $15,750 | $58,100 |
| 2020 | $4,447 | $73,850 | $15,750 | $58,100 |
| 2019 | $4,447 | $73,850 | $15,750 | $58,100 |
| 2018 | $4,312 | $71,610 | $15,750 | $55,860 |
| 2017 | $4,336 | $72,020 | $15,740 | $56,280 |
| 2016 | $4,336 | $72,020 | $15,740 | $56,280 |
| 2015 | $4,193 | $72,020 | $15,740 | $56,280 |
| 2014 | $4,193 | $72,020 | $15,740 | $56,280 |
Source: Public Records
Map
Nearby Homes
- 21 Whittlesey Ave
- 0372 Floyd St
- 0039 Floyd St
- 41L Floyd St
- 242 Madison St
- 41 Floyd St
- 51 Clover St
- 947 Pearl Lake Rd
- 35 Mountain Village Rd Unit 30
- 439 Piedmont St
- 41 Laval St
- 40 Laval St
- 273 Piedmont St
- 1135 Hamilton Ave
- 44 Shadybrook Ln
- 335 Raymond St
- 00 Milton Ave
- 60 Gayfield Rd
- 170 Purdy Rd
- 864 Baldwin St
- 184 Farrington Ave
- 198 Farrington Ave
- 173 Farrington Ave
- 189 Farrington Ave
- 189 Farrington Ave
- 197 Farrington Ave
- 46 Proctor St
- 56 Proctor St
- 34 Proctor St
- 203 Farrington Ave
- 74 Proctor St
- 76 Proctor St
- 80 Proctor St
- 208 Farrington Ave
- 45 Proctor St
- 41 Proctor St
- 211 Farrington Ave
- 61 Proctor St
- 59 Proctor St
- 57 Proctor St