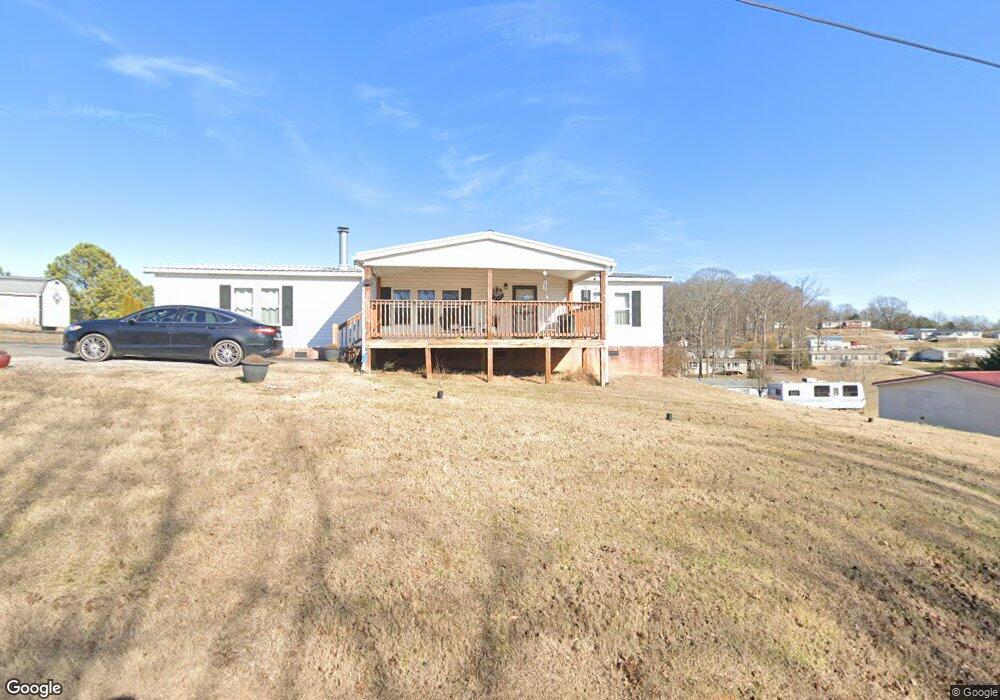
0 Antler Ridge Rd Unit 897983 Dandridge, TN 37725
Estimated Value: $244,000 - $302,000
--
Bed
--
Bath
1,431
Sq Ft
$188/Sq Ft
Est. Value
About This Home
This home is located at 0 Antler Ridge Rd Unit 897983, Dandridge, TN 37725 and is currently estimated at $268,667, approximately $187 per square foot. 0 Antler Ridge Rd Unit 897983 is a home located in Jefferson County.
Ownership History
Date
Name
Owned For
Owner Type
Purchase Details
Closed on
May 7, 2025
Sold by
Francis Deborah A
Bought by
Woodard Sherrod T
Current Estimated Value
Home Financials for this Owner
Home Financials are based on the most recent Mortgage that was taken out on this home.
Original Mortgage
$266,514
Outstanding Balance
$265,568
Interest Rate
6.64%
Mortgage Type
VA
Estimated Equity
$3,099
Purchase Details
Closed on
Jan 15, 2016
Sold by
Cmh Homes Inc
Bought by
Francis Richard A and Francis Deborah A
Purchase Details
Closed on
Aug 31, 2015
Sold by
Best Value Housing Inc
Bought by
Cmh Homes Inc
Purchase Details
Closed on
Nov 14, 2013
Sold by
Stewart Brenda J
Bought by
Letcher John Frank and Letcher Joline Judith
Home Financials for this Owner
Home Financials are based on the most recent Mortgage that was taken out on this home.
Original Mortgage
$67,000
Interest Rate
4.31%
Mortgage Type
Commercial
Purchase Details
Closed on
Mar 1, 2007
Bought by
Best Value Housing Inc
Create a Home Valuation Report for This Property
The Home Valuation Report is an in-depth analysis detailing your home's value as well as a comparison with similar homes in the area
Home Values in the Area
Average Home Value in this Area
Purchase History
| Date | Buyer | Sale Price | Title Company |
|---|---|---|---|
| Woodard Sherrod T | $258,000 | Concord Title | |
| Woodard Sherrod T | $258,000 | Concord Title | |
| Francis Richard A | $120,707 | -- | |
| Cmh Homes Inc | $15,000 | -- | |
| Letcher John Frank | $40,000 | -- | |
| Best Value Housing Inc | $30,800 | -- |
Source: Public Records
Mortgage History
| Date | Status | Borrower | Loan Amount |
|---|---|---|---|
| Open | Woodard Sherrod T | $266,514 | |
| Closed | Woodard Sherrod T | $266,514 | |
| Previous Owner | Letcher John Frank | $67,000 |
Source: Public Records
Tax History Compared to Growth
Tax History
| Year | Tax Paid | Tax Assessment Tax Assessment Total Assessment is a certain percentage of the fair market value that is determined by local assessors to be the total taxable value of land and additions on the property. | Land | Improvement |
|---|---|---|---|---|
| 2025 | $506 | $43,775 | $5,325 | $38,450 |
| 2023 | $506 | $22,000 | $0 | $0 |
| 2022 | $482 | $22,000 | $4,250 | $17,750 |
| 2021 | $482 | $22,000 | $4,250 | $17,750 |
| 2020 | $482 | $22,000 | $4,250 | $17,750 |
| 2019 | $482 | $22,000 | $4,250 | $17,750 |
| 2018 | $485 | $20,650 | $4,250 | $16,400 |
| 2017 | $485 | $20,650 | $4,250 | $16,400 |
| 2016 | $452 | $20,650 | $4,250 | $16,400 |
| 2015 | $100 | $4,250 | $4,250 | $0 |
| 2014 | -- | $5,000 | $5,000 | $0 |
Source: Public Records
Map
Nearby Homes
- 0 Antler Ridge Unit 1298515
- Lot 10 Antler Ridge
- 603 Saint John's Dr
- Lot 7 Saint John's Dr
- Lot 9 Saint John's Dr
- lot 4 Saint John's Dr
- 1126 Sunshine Dr
- 1527 Squire Fox Rd
- 1467 Squire Fox Rd
- 1451 Squire Fox Rd
- 642 Privet Dr
- 252 Slaton Farm Rd
- 216 Slaton Farm Rd
- 639 Keene Cir
- 792 Rh Ellis Rd
- 755 Rh Ellis Rd
- 839 Quiet Oaks Way
- 0 Antler Ridge Rd Unit 691749
- 0 Antler Ridge Rd Unit 731396
- 0 Antler Ridge Rd Unit 757904
- 0 Antler Ridge Unit 312461
- 0 Antler Ridge Unit 1201619
- 0 Antler Ridge Unit 882716
- 0 Antler Ridge Unit 1173124
- 331 Antler Ridge
- 326 Antler Ridge
- 334 Antler Ridge
- 339 Antler Ridge
- 325 Antler Ridge
- GREEN Hill Rd
- 322 Antler Ridge
- 322 Antler Ridge
- 321 Antler Ridge
- TBD Antler Ridge
- Lots 11,21,2 Antler Ridge
- 316 Antler Ridge
- Lot 11 Antler Ridge