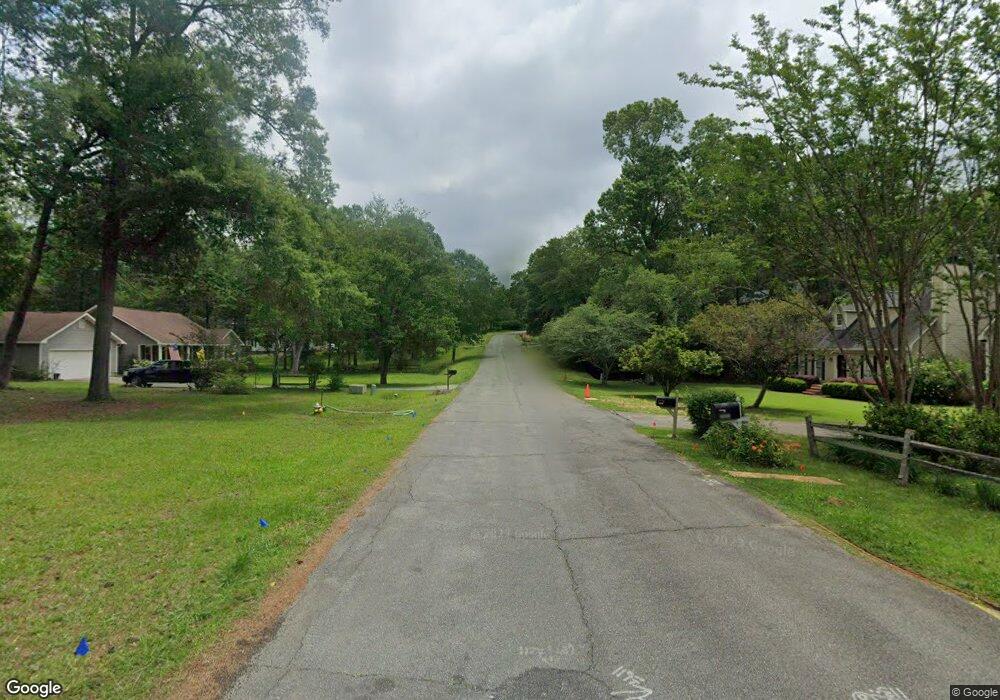
0 Huddersfield Rd Unit 7605768 Macon, GA 31210
Estimated Value: $244,000 - $271,363
3
Beds
2
Baths
2,057
Sq Ft
$123/Sq Ft
Est. Value
About This Home
This home is located at 0 Huddersfield Rd Unit 7605768, Macon, GA 31210 and is currently estimated at $253,841, approximately $123 per square foot. 0 Huddersfield Rd Unit 7605768 is a home located in Bibb County with nearby schools including Carter Elementary School, Howard Middle School, and Howard High School.
Ownership History
Date
Name
Owned For
Owner Type
Purchase Details
Closed on
Aug 26, 2016
Bought by
Reynolds Moira A
Current Estimated Value
Home Financials for this Owner
Home Financials are based on the most recent Mortgage that was taken out on this home.
Original Mortgage
$103,790
Outstanding Balance
$82,588
Interest Rate
3.48%
Mortgage Type
New Conventional
Estimated Equity
$171,253
Purchase Details
Closed on
May 3, 2016
Sold by
Pennymac Loan Svcs Llc
Bought by
Sec Of Veterans Affairs
Purchase Details
Closed on
Jul 1, 2014
Sold by
Mcgee Jay
Bought by
Mays Samuel
Home Financials for this Owner
Home Financials are based on the most recent Mortgage that was taken out on this home.
Original Mortgage
$121,558
Interest Rate
4.17%
Mortgage Type
VA
Purchase Details
Closed on
Jun 3, 2013
Sold by
Upright Virginia C and Mcgee Jay
Bought by
Mcgee Jay
Purchase Details
Closed on
Feb 28, 2006
Sold by
Upright Edward L D-1-13-2006
Bought by
Upright Virginia C
Create a Home Valuation Report for This Property
The Home Valuation Report is an in-depth analysis detailing your home's value as well as a comparison with similar homes in the area
Home Values in the Area
Average Home Value in this Area
Purchase History
| Date | Buyer | Sale Price | Title Company |
|---|---|---|---|
| Reynolds Moira A | $107,000 | -- | |
| Sec Of Veterans Affairs | -- | -- | |
| Pennymac Loan Svcs Llc | $99,600 | -- | |
| Mays Samuel | $119,000 | None Available | |
| Mcgee Jay | -- | None Available | |
| Upright Virginia C | -- | -- |
Source: Public Records
Mortgage History
| Date | Status | Borrower | Loan Amount |
|---|---|---|---|
| Open | Reynolds Moira A | $103,790 | |
| Previous Owner | Mays Samuel | $121,558 |
Source: Public Records
Tax History Compared to Growth
Tax History
| Year | Tax Paid | Tax Assessment Tax Assessment Total Assessment is a certain percentage of the fair market value that is determined by local assessors to be the total taxable value of land and additions on the property. | Land | Improvement |
|---|---|---|---|---|
| 2025 | $2,156 | $94,718 | $9,380 | $85,338 |
| 2024 | $2,228 | $94,718 | $9,380 | $85,338 |
| 2023 | $1,409 | $80,495 | $9,380 | $71,115 |
| 2022 | $2,161 | $69,423 | $10,500 | $58,923 |
| 2021 | $2,210 | $65,152 | $9,240 | $55,912 |
| 2020 | $1,975 | $57,861 | $8,400 | $49,461 |
| 2019 | $1,991 | $57,861 | $8,400 | $49,461 |
| 2018 | $2,584 | $47,108 | $8,400 | $38,708 |
| 2017 | $1,341 | $47,108 | $8,400 | $38,708 |
| 2016 | $1,965 | $56,786 | $8,400 | $48,386 |
| 2015 | $2,331 | $61,463 | $8,400 | $53,063 |
| 2014 | $3,038 | $61,947 | $8,400 | $53,547 |
Source: Public Records
Map
Nearby Homes
- 163 Broadleaf Dr
- 218 Matlock Ln
- 200 Stone Edge Rd
- 103 Howard Oaks Dr
- 106 Trillium Terrace
- 155 Howard Oaks Dr
- 118 Ashford Park
- 103 Hanover Place
- 131 Ashford Park
- 331 Marjane Dr
- 228 Lagrange Ct
- 107 N Wellington
- 105 N Wellington
- 180 Autumn Trace Ct
- 200 Autumn Trace Ct
- 110 Aston Hall
- 1069 Greentree Pkwy
- 311 Castlegate Rd
- 157 Camden Trace
- 153 Camden Trace
- 0 Huddersfield Rd Unit 7410346
- 5835 Huddersfield Rd
- 5835 Huddersfield Rd Unit 129
- 5783 Wakefield Way
- 5843 Huddersfield Rd
- 5798 Wakefield Way
- 5832 Huddersfield Rd
- 5771 Wakefield Way
- 5780 Wakefield Way
- 5857 Huddersfield Rd
- 5838 Huddersfield Rd
- 5826 Huddersfield Rd
- 5823 Huddersfield Rd
- 5770 Wakefield Way
- 5844 Huddersfield Rd
- 5765 Wakefield Way
- 5820 Huddersfield Rd
- 5850 Huddersfield Rd
- 5785 Huddersfield Rd
- 5817 Huddersfield Rd