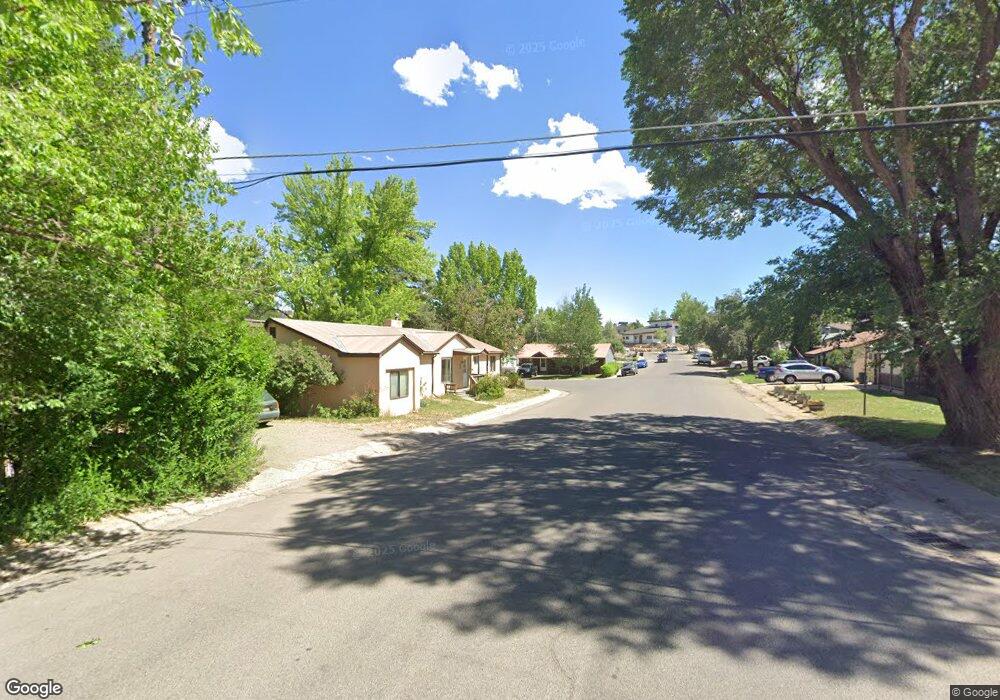
0 San Juan Dr Unit 645608 Durango, CO 81301
Crestview NeighborhoodEstimated Value: $645,053 - $714,000
3
Beds
1
Bath
1,176
Sq Ft
$581/Sq Ft
Est. Value
About This Home
This home is located at 0 San Juan Dr Unit 645608, Durango, CO 81301 and is currently estimated at $683,513, approximately $581 per square foot. 0 San Juan Dr Unit 645608 is a home located in La Plata County with nearby schools including Needham Elementary School, Miller Middle School, and Durango High School.
Ownership History
Date
Name
Owned For
Owner Type
Purchase Details
Closed on
Nov 3, 2025
Sold by
Helen N Marshall Trust and Marshall Helen N
Bought by
Neuman Marshall Lindsay and Mclean Liggett Bryant
Current Estimated Value
Home Financials for this Owner
Home Financials are based on the most recent Mortgage that was taken out on this home.
Original Mortgage
$500,000
Outstanding Balance
$500,000
Interest Rate
6.26%
Mortgage Type
New Conventional
Estimated Equity
$183,513
Purchase Details
Closed on
Sep 23, 2021
Sold by
Marshall Helen and Marshall Helen N
Bought by
Marshall Helen N and The Helen N Marshall Trust
Purchase Details
Closed on
May 5, 2015
Sold by
Swanson Todd Dennis
Bought by
Marshall Helen
Purchase Details
Closed on
Jun 23, 2011
Sold by
Hudgens Christine Renae and Hedgens Alver George
Bought by
Swanson Todd Dennis
Home Financials for this Owner
Home Financials are based on the most recent Mortgage that was taken out on this home.
Original Mortgage
$221,600
Interest Rate
4.7%
Mortgage Type
New Conventional
Purchase Details
Closed on
Aug 31, 1994
Bought by
Marshall Helen
Create a Home Valuation Report for This Property
The Home Valuation Report is an in-depth analysis detailing your home's value as well as a comparison with similar homes in the area
Home Values in the Area
Average Home Value in this Area
Purchase History
| Date | Buyer | Sale Price | Title Company |
|---|---|---|---|
| Neuman Marshall Lindsay | $650,000 | Land Title Guarantee | |
| Marshall Helen N | -- | None Available | |
| Marshall Helen | $375,000 | Land Title Guarantee Company | |
| Swanson Todd Dennis | $277,000 | Land Title Guarantee Company | |
| Marshall Helen | $97,500 | -- |
Source: Public Records
Mortgage History
| Date | Status | Borrower | Loan Amount |
|---|---|---|---|
| Open | Neuman Marshall Lindsay | $500,000 | |
| Previous Owner | Swanson Todd Dennis | $221,600 |
Source: Public Records
Tax History
| Year | Tax Paid | Tax Assessment Tax Assessment Total Assessment is a certain percentage of the fair market value that is determined by local assessors to be the total taxable value of land and additions on the property. | Land | Improvement |
|---|---|---|---|---|
| 2025 | $1,565 | $40,560 | $14,610 | $25,950 |
| 2024 | $1,331 | $33,120 | $10,630 | $22,490 |
| 2023 | $1,331 | $36,140 | $11,600 | $24,540 |
| 2022 | $1,189 | $38,170 | $12,250 | $25,920 |
| 2021 | $1,194 | $30,090 | $10,550 | $19,540 |
| 2020 | $1,109 | $28,840 | $10,460 | $18,380 |
| 2019 | $1,061 | $28,840 | $10,460 | $18,380 |
| 2018 | $1,008 | $27,760 | $10,650 | $17,110 |
| 2017 | $986 | $27,760 | $10,650 | $17,110 |
| 2016 | $826 | $25,340 | $9,440 | $15,900 |
| 2015 | $774 | $25,340 | $9,440 | $15,900 |
| 2014 | -- | $22,300 | $9,050 | $13,250 |
| 2013 | -- | $22,300 | $9,050 | $13,250 |
Source: Public Records
Map
Nearby Homes
- 362 W 23rd St
- 2400 Arroyo Dr Unit 22
- 416 W 28th St
- 1857 & 1865 W 3rd Ave
- 1867 W 2nd Ave
- 1840 W 3rd Ave
- 3015 Hillside Ave
- 485 Florida Rd Unit C5
- 485 Florida Rd Unit B-15
- 485 Florida Rd Unit C-17
- TBD - Lot G Highway 550
- TBD (Tract C) Highway 550
- 49789 Highway 550
- 18 Miller Dr
- 1404 E 3rd Ave
- 12 Falcon Way
- 3211 W 2 Nd Ave
- 1330 E 3rd Ave
- 1201 Main Ave Unit 105
- 2718 New Mexico Ave Unit D
- 0 San Juan Dr Unit 754791
- 0 San Juan Dr Unit 745730
- 0 San Juan Dr Unit 735289
- 0 San Juan Dr Unit 695136
- 0 San Juan Dr Unit 621245
- 0 San Juan Dr Unit 655763
- 0 San Juan Dr Unit 680276
- 0 San Juan Dr Unit 683861
- 0 San Juan Dr Unit 705626
- 420 San Juan Dr
- 430 San Juan Dr
- 400 San Juan Dr
- 450 San Juan Dr
- 402 Arroyo Dr
- 401 Arroyo Dr
- 404 Arroyo Dr
- 460 San Juan Dr
- 406 Arroyo Dr
- 500 Arroyo Dr
- 470 San Juan Dr
Your Personal Tour Guide
Ask me questions while you tour the home.