Estimated Value: $453,000 - $558,294
3
Beds
2
Baths
2,112
Sq Ft
$244/Sq Ft
Est. Value
About This Home
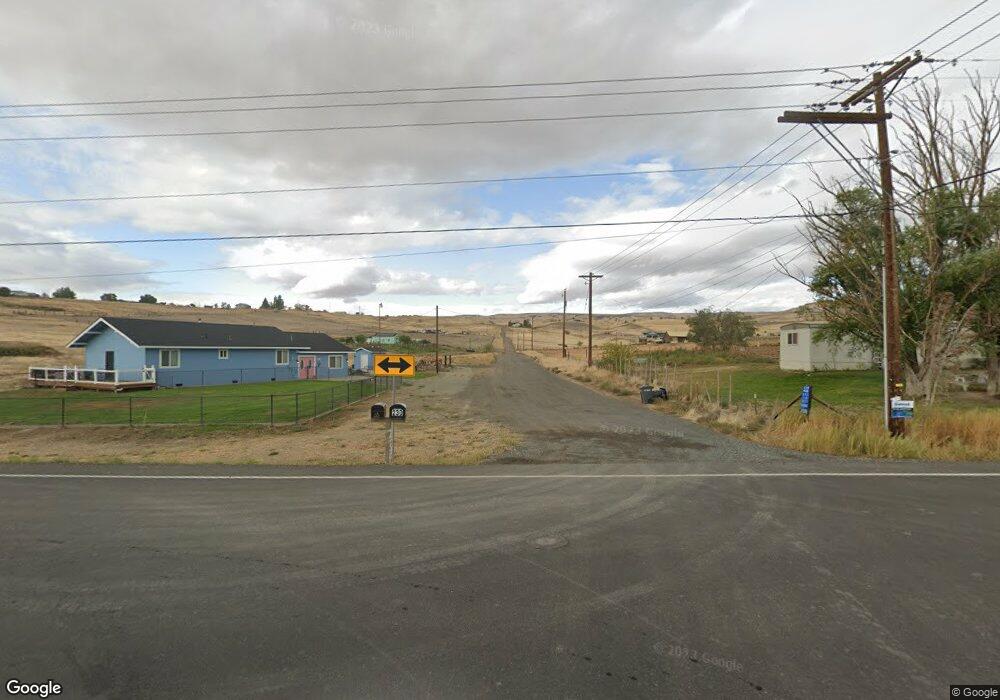
This home is located at 000 Beane Postma Lot #3 Rd, Moxee, WA 98936 and is currently estimated at $516,098, approximately $244 per square foot. 000 Beane Postma Lot #3 Rd is a home located in Yakima County with nearby schools including East Valley High School.
Ownership History
Date
Name
Owned For
Owner Type
Purchase Details
Closed on
Aug 11, 2012
Sold by
Jones Kathleen and Jones Jason R
Bought by
Jones Jason R and Jones Kathleen
Current Estimated Value
Home Financials for this Owner
Home Financials are based on the most recent Mortgage that was taken out on this home.
Original Mortgage
$265,000
Outstanding Balance
$113,150
Interest Rate
3.5%
Mortgage Type
New Conventional
Estimated Equity
$402,948
Purchase Details
Closed on
Aug 16, 2007
Sold by
Burgess Marvin and Burgess Cheryl
Bought by
Elrich Kathleen and Jones Jason R
Home Financials for this Owner
Home Financials are based on the most recent Mortgage that was taken out on this home.
Original Mortgage
$274,550
Interest Rate
6.73%
Mortgage Type
Construction
Purchase Details
Closed on
Feb 25, 2005
Sold by
Belaire Victor W
Bought by
Burgess Marvin and Burgess Cheryl
Create a Home Valuation Report for This Property
The Home Valuation Report is an in-depth analysis detailing your home's value as well as a comparison with similar homes in the area
Purchase History
| Date | Buyer | Sale Price | Title Company |
|---|---|---|---|
| Jones Jason R | -- | Performance Title Inc | |
| Elrich Kathleen | $52,000 | Valley Title Company | |
| Burgess Marvin | $44,573 | Fidelity Title Company |
Source: Public Records
Mortgage History
| Date | Status | Borrower | Loan Amount |
|---|---|---|---|
| Open | Jones Jason R | $265,000 | |
| Closed | Elrich Kathleen | $274,550 |
Source: Public Records
Tax History
| Year | Tax Paid | Tax Assessment Tax Assessment Total Assessment is a certain percentage of the fair market value that is determined by local assessors to be the total taxable value of land and additions on the property. | Land | Improvement |
|---|---|---|---|---|
| 2025 | $5,136 | $511,600 | $67,800 | $443,800 |
| 2023 | $4,596 | $393,500 | $61,300 | $332,200 |
| 2022 | $4,272 | $347,700 | $59,700 | $288,000 |
| 2021 | $3,956 | $308,900 | $57,600 | $251,300 |
| 2019 | $3,269 | $250,300 | $57,600 | $192,700 |
| 2018 | $3,204 | $230,100 | $54,200 | $175,900 |
| 2017 | $3,142 | $237,600 | $57,000 | $180,600 |
| 2016 | $3,295 | $237,200 | $57,000 | $180,200 |
| 2015 | $3,295 | $238,900 | $57,000 | $181,900 |
| 2014 | $3,295 | $239,700 | $57,000 | $182,700 |
| 2013 | $3,295 | $239,700 | $57,000 | $182,700 |
Source: Public Records
Map
Nearby Homes
- 0 NKA Desmarais Rd
- 180 Hi Valley View St
- 107 Palisade St
- 104 Bravo St
- 519 Lacoursiere St
- 514 Cascade Ave
- NKA High Point Landing
- 506 Cascade Ave
- 461 White Rd
- NKA Rivard Rd
- 8711 Postma Rd
- 204 N Spokane St
- 7800 Postma Rd
- NKA Sommerset
- 230 S Clark Heights Rd
- 2206 Porter Loop
- 150 Solar Ln
- NKA Solar Ln
- NKA Spring View Dr
- 761 Nightingale Rd
- 77 Beane Rd
- 205 Beane Rd
- 75 Beane Rd
- 73 Beane Rd
- 71 Beane Rd
- 71 Beane Rd Unit 5 Level Acres
- 201 Beane Rd
- 12381 Postma Rd
- 12411 Postma Rd
- NNA Beane Lot 1 Rd
- 203 Beane Rd
- NNA Beane Lot 3 Rd
- 12341 Postma Rd
- 12401 Postma Rd
- 30 Beane Rd
- 50 N Beane Rd
- 150 Beane Rd
- 12698 Postma Rd
- 220 Beane Rd
- 151 N Beane Rd
Your Personal Tour Guide
Ask me questions while you tour the home.