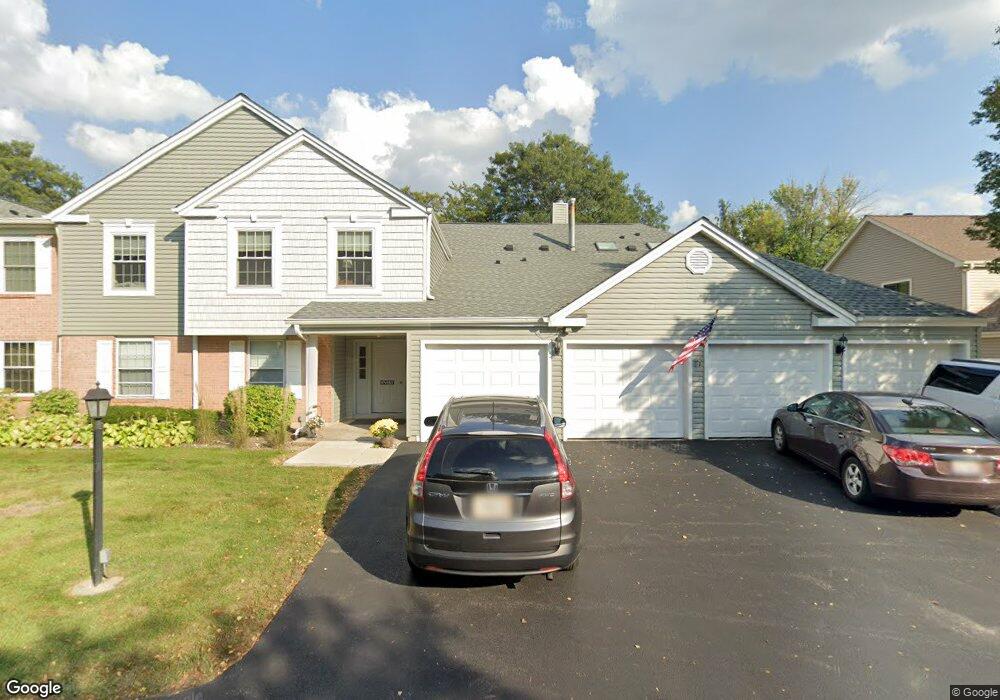
0N065 Coniston Ct Unit 708 Winfield, IL 60190
Estimated Value: $265,000 - $284,000
2
Beds
2
Baths
1,098
Sq Ft
$251/Sq Ft
Est. Value
About This Home
This home is located at 0N065 Coniston Ct Unit 708, Winfield, IL 60190 and is currently estimated at $275,869, approximately $251 per square foot. 0N065 Coniston Ct Unit 708 is a home located in DuPage County with nearby schools including Winfield Central School, Winfield Primary School, and West Chicago Community High School.
Ownership History
Date
Name
Owned For
Owner Type
Purchase Details
Closed on
Jun 5, 2017
Sold by
Atkinson Peggy
Bought by
Atkinson Peggy and The Peggy Atkinson Trust
Current Estimated Value
Purchase Details
Closed on
Feb 26, 2007
Sold by
Luff Joshua and Luff Sarah
Bought by
Atkinson Peggy L
Home Financials for this Owner
Home Financials are based on the most recent Mortgage that was taken out on this home.
Original Mortgage
$136,500
Outstanding Balance
$82,712
Interest Rate
6.28%
Mortgage Type
Purchase Money Mortgage
Estimated Equity
$193,157
Purchase Details
Closed on
Feb 24, 2005
Sold by
Wolff Eileen M
Bought by
Luff Joshua and Mastroianni Sarah
Home Financials for this Owner
Home Financials are based on the most recent Mortgage that was taken out on this home.
Original Mortgage
$153,000
Interest Rate
5.7%
Mortgage Type
Purchase Money Mortgage
Purchase Details
Closed on
Jan 10, 2003
Sold by
Oconnor Roy J
Bought by
Oconnor Roy J and The Roy J Oconnor Declaration Of Trust
Create a Home Valuation Report for This Property
The Home Valuation Report is an in-depth analysis detailing your home's value as well as a comparison with similar homes in the area
Home Values in the Area
Average Home Value in this Area
Purchase History
| Date | Buyer | Sale Price | Title Company |
|---|---|---|---|
| Atkinson Peggy | -- | None Available | |
| Atkinson Peggy L | $186,500 | Ticor Title | |
| Luff Joshua | $170,000 | Atg | |
| Oconnor Roy J | -- | -- |
Source: Public Records
Mortgage History
| Date | Status | Borrower | Loan Amount |
|---|---|---|---|
| Open | Atkinson Peggy L | $136,500 | |
| Previous Owner | Luff Joshua | $153,000 |
Source: Public Records
Tax History
| Year | Tax Paid | Tax Assessment Tax Assessment Total Assessment is a certain percentage of the fair market value that is determined by local assessors to be the total taxable value of land and additions on the property. | Land | Improvement |
|---|---|---|---|---|
| 2024 | $4,694 | $70,534 | $14,037 | $56,497 |
| 2023 | $4,459 | $64,420 | $12,820 | $51,600 |
| 2022 | $4,273 | $60,220 | $11,990 | $48,230 |
| 2021 | $4,010 | $57,720 | $11,490 | $46,230 |
| 2020 | $3,933 | $55,970 | $11,140 | $44,830 |
| 2019 | $3,892 | $53,300 | $10,610 | $42,690 |
| 2018 | $3,788 | $51,240 | $10,200 | $41,040 |
| 2017 | $3,678 | $48,690 | $9,690 | $39,000 |
| 2016 | $3,558 | $45,390 | $9,030 | $36,360 |
| 2015 | $3,471 | $42,020 | $8,360 | $33,660 |
| 2014 | $3,433 | $40,720 | $8,110 | $32,610 |
| 2013 | $3,828 | $46,880 | $8,410 | $38,470 |
Source: Public Records
Map
Nearby Homes
- 0N018 Windermere Rd Unit 301
- 933 Preserve Ct Unit 2003
- 937 Preserve Ct Unit 2001
- 0N068 Forsythe Ct
- 0N082 Forsythe Ct
- 0N052 Woodland Ct
- 27W225 Ash Ct
- 27W180 Cooley Ave
- 27W266 Oakwood St
- 0S340 Forest St
- 27W145 Cooley Ave
- 27W073 Jewell Rd
- 27W439 Chartwell Dr
- 0S348 East St
- 26W548 Prairie Ave
- 28W185 Geneva Rd
- 0S760 Cleveland St
- 0S064 Calvin Ct
- 27W327 Williams St
- 27W210 Providence Ln Unit 1
- 0N061 Coniston Ct Unit 606
- 0N061 Coniston Ct Unit 605
- 0N061 Coniston Ct Unit 601
- 0N120 Ennerdale Ln Unit 1506
- 0N073 Windermere Rd Unit 2201
- 0N128 Ennerdale Ln Unit 1401
- 0N115 Coniston Ct Unit 903
- 0N115 Coniston Ct Unit 908
- 0N033 Coniston Ct Unit 504
- 0N073 Windermere Rd Unit 2202
- 0N065 Windermere Rd Unit 2307
- 0N115 Coniston Ct
- 0N065 Windermere Rd Unit 2303
- 0N212 Windermere Rd Unit 2804
- 0N120 Ennerdale Ln Unit 1502
- 0N212 Windermere Rd Unit 2807
- 0N111 Coniston Ct Unit 801
- 0N116 Ennerdale Ln Unit 1608
- 0N178 Windermere Rd
- 0N037 Coniston Ct Unit 506
Your Personal Tour Guide
Ask me questions while you tour the home.