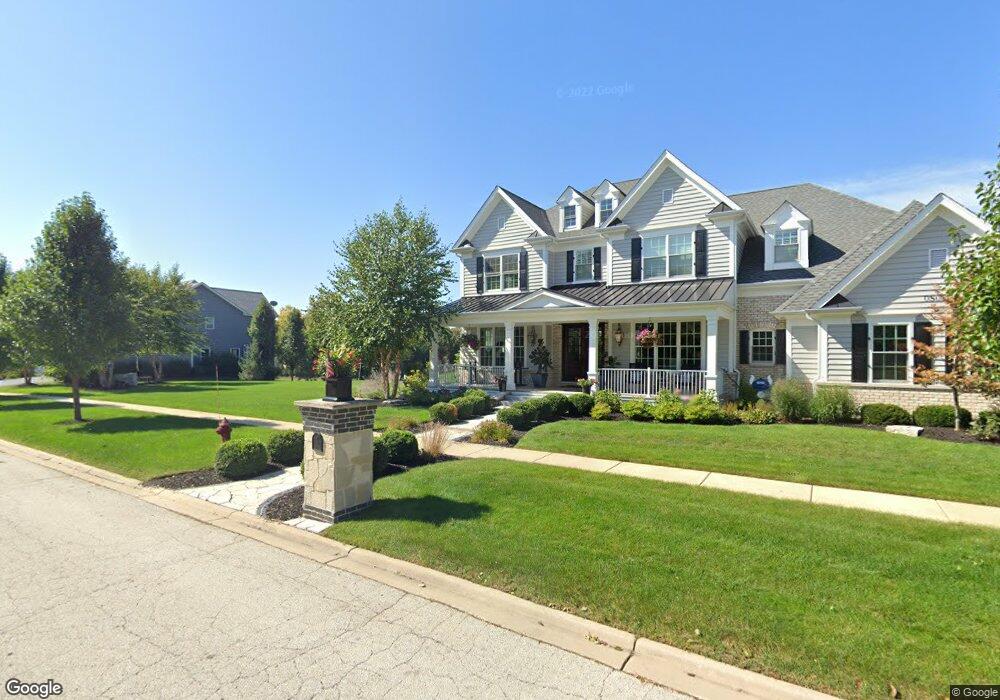
0S167 Willis Cir Geneva, IL 60134
Mill Creek NeighborhoodEstimated Value: $729,000 - $1,111,000
4
Beds
4
Baths
4,318
Sq Ft
$224/Sq Ft
Est. Value
About This Home
This home is located at 0S167 Willis Cir, Geneva, IL 60134 and is currently estimated at $965,414, approximately $223 per square foot. 0S167 Willis Cir is a home with nearby schools including Fabyan Elementary School and Geneva Community High School.
Ownership History
Date
Name
Owned For
Owner Type
Purchase Details
Closed on
Apr 6, 2021
Sold by
Caballero Rafael and Caballero Amy H
Bought by
Duong Virginia and Martin Christopher
Current Estimated Value
Home Financials for this Owner
Home Financials are based on the most recent Mortgage that was taken out on this home.
Original Mortgage
$807,000
Interest Rate
2.9%
Mortgage Type
New Conventional
Purchase Details
Closed on
Dec 20, 2005
Sold by
Sho Deen Inc
Bought by
Caballero Rafael and Caballero Amy H
Home Financials for this Owner
Home Financials are based on the most recent Mortgage that was taken out on this home.
Original Mortgage
$405,000
Interest Rate
6.48%
Mortgage Type
Fannie Mae Freddie Mac
Purchase Details
Closed on
Dec 15, 2005
Sold by
The State Bank Of Geneva
Bought by
Sho Deen Inc
Home Financials for this Owner
Home Financials are based on the most recent Mortgage that was taken out on this home.
Original Mortgage
$405,000
Interest Rate
6.48%
Mortgage Type
Fannie Mae Freddie Mac
Create a Home Valuation Report for This Property
The Home Valuation Report is an in-depth analysis detailing your home's value as well as a comparison with similar homes in the area
Home Values in the Area
Average Home Value in this Area
Purchase History
| Date | Buyer | Sale Price | Title Company |
|---|---|---|---|
| Duong Virginia | $907,000 | Proper Title Llc | |
| Caballero Rafael | $834,000 | Chicago Title Insurance Co | |
| Sho Deen Inc | -- | Chicago Title Insurance Comp |
Source: Public Records
Mortgage History
| Date | Status | Borrower | Loan Amount |
|---|---|---|---|
| Previous Owner | Duong Virginia | $807,000 | |
| Previous Owner | Caballero Rafael | $405,000 |
Source: Public Records
Tax History Compared to Growth
Tax History
| Year | Tax Paid | Tax Assessment Tax Assessment Total Assessment is a certain percentage of the fair market value that is determined by local assessors to be the total taxable value of land and additions on the property. | Land | Improvement |
|---|---|---|---|---|
| 2024 | $22,052 | $273,440 | $42,002 | $231,438 |
| 2023 | $21,333 | $246,787 | $37,908 | $208,879 |
| 2022 | $21,773 | $245,140 | $34,791 | $210,349 |
| 2021 | $19,063 | $212,877 | $33,299 | $179,578 |
| 2020 | $18,532 | $207,888 | $32,519 | $175,369 |
| 2019 | $18,470 | $204,836 | $32,042 | $172,794 |
| 2018 | $19,059 | $211,655 | $32,042 | $179,613 |
| 2017 | $19,048 | $209,249 | $31,678 | $177,571 |
| 2016 | $19,459 | $212,031 | $30,842 | $181,189 |
| 2015 | -- | $214,595 | $29,639 | $184,956 |
| 2014 | -- | $210,492 | $32,979 | $177,513 |
| 2013 | -- | $210,492 | $32,979 | $177,513 |
Source: Public Records
Map
Nearby Homes
- 39W796 N Hathaway Ln
- Abigail Ranch Plan at Mill Creek North - Mill Creek
- The Northstar Ranch Plan at Mill Creek North - Mill Creek
- Carrington Plan at Mill Creek North - Mill Creek
- Chickory Plan at Mill Creek North - Mill Creek
- Blue Stem Plan at Mill Creek North - Mill Creek
- 0S170 Bealer Cir
- 39W915 Catlin Square
- 39W841 S Hathaway Ln
- Lot 2 Fabyan Pkwy
- Lot 1 Fabyan Pkwy
- 0 Fabyan Pkwy Unit MRD12461823
- 39W644 Harvey Square
- 39W275 Fabyan Pkwy
- 39W380 Armstrong Ln
- 0N285 King Dr
- 0N404 N Mill Creek Dr
- 0N401 Taylor Dr
- N612 W Weaver Cir
- 0N553 Armstrong Ln
- 0S170 Willis Cir
- 0S165 Willis Cir
- 0S150 Willis Cir
- 0S163 Willis Cir
- 0S177 Catlin Square
- 0S157 Catlin Square
- 0S120 Willis Cir
- S120 Willis Cir
- 0S161 Willis Cir
- 0S121 Willis Cir
- 0S137 Catlin Square
- 0S155 Willis Cir
- 0S237 Kellar Square
- 39W753 N Hathaway Ln
- 0S112 Willis Cir
- 39W729 N Hathaway (H50) Ln
- 39W809 N Hathaway Ln
- 39W889 N Hathaway Ln
- 0S091 Willis Cir
- 39W795 Catlin Square