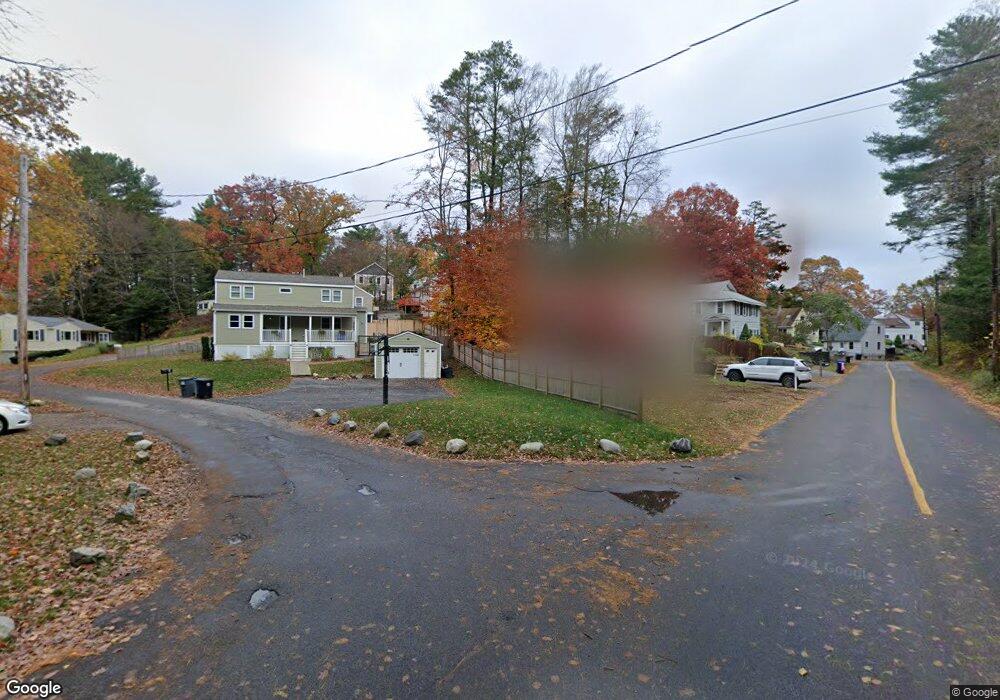
1 & 2 Longfellow Rd Wenham, MA 01984
Estimated Value: $800,793 - $929,000
4
Beds
3
Baths
1,650
Sq Ft
$527/Sq Ft
Est. Value
About This Home
This home is located at 1 & 2 Longfellow Rd, Wenham, MA 01984 and is currently estimated at $869,698, approximately $527 per square foot. 1 & 2 Longfellow Rd is a home located in Essex County with nearby schools including Winthrop School, Cutler Elementary School, and Miles River Middle School.
Ownership History
Date
Name
Owned For
Owner Type
Purchase Details
Closed on
Sep 30, 2015
Sold by
2 Longfellow Rt
Bought by
Vesey Craig J and Vesey Monica L
Current Estimated Value
Home Financials for this Owner
Home Financials are based on the most recent Mortgage that was taken out on this home.
Original Mortgage
$350,400
Outstanding Balance
$276,345
Interest Rate
3.95%
Mortgage Type
New Conventional
Estimated Equity
$593,353
Purchase Details
Closed on
Oct 25, 2013
Sold by
Simple Home Solutions
Bought by
2 Longfellow Rt
Purchase Details
Closed on
Sep 11, 2013
Sold by
Theriault Janet L
Bought by
Simple Homes Solutns L
Purchase Details
Closed on
Jul 25, 1996
Sold by
Steen Alma L
Bought by
Theriault Ronald L and Theriault Janet L
Home Financials for this Owner
Home Financials are based on the most recent Mortgage that was taken out on this home.
Original Mortgage
$53,000
Interest Rate
8.37%
Mortgage Type
Purchase Money Mortgage
Create a Home Valuation Report for This Property
The Home Valuation Report is an in-depth analysis detailing your home's value as well as a comparison with similar homes in the area
Home Values in the Area
Average Home Value in this Area
Purchase History
| Date | Buyer | Sale Price | Title Company |
|---|---|---|---|
| Vesey Craig J | $438,000 | -- | |
| 2 Longfellow Rt | -- | -- | |
| Simple Homes Solutns L | $146,000 | -- | |
| Theriault Ronald L | $118,000 | -- |
Source: Public Records
Mortgage History
| Date | Status | Borrower | Loan Amount |
|---|---|---|---|
| Open | Vesey Craig J | $350,400 | |
| Previous Owner | Theriault Ronald L | $300,000 | |
| Previous Owner | Theriault Ronald L | $53,000 |
Source: Public Records
Tax History Compared to Growth
Tax History
| Year | Tax Paid | Tax Assessment Tax Assessment Total Assessment is a certain percentage of the fair market value that is determined by local assessors to be the total taxable value of land and additions on the property. | Land | Improvement |
|---|---|---|---|---|
| 2025 | $10,359 | $666,600 | $327,300 | $339,300 |
| 2024 | $10,113 | $645,800 | $327,300 | $318,500 |
| 2023 | $8,880 | $511,800 | $255,700 | $256,100 |
| 2022 | $9,933 | $507,300 | $255,700 | $251,600 |
| 2021 | $9,606 | $488,100 | $236,500 | $251,600 |
| 2020 | $9,178 | $484,600 | $236,400 | $248,200 |
| 2019 | $8,732 | $484,600 | $236,400 | $248,200 |
| 2018 | $8,008 | $426,200 | $213,900 | $212,300 |
| 2017 | $7,812 | $426,200 | $213,900 | $212,300 |
| 2016 | $6,092 | $358,800 | $213,900 | $144,900 |
| 2015 | $5,684 | $349,800 | $150,900 | $198,900 |
Source: Public Records
Map
Nearby Homes
- 2 Longfellow Rd
- 101 Pleasant St
- 101 Pleasant St
- 103 Pleasant St
- 4 Longfellow Rd
- 105 Pleasant St
- 9 Batchelder Park
- 9 South St
- 3 Longfellow Rd
- 98 Pleasant St
- 5 South St
- 3 South St
- 7 Longfellow Rd
- 0 Longfellow Rd
- 0 Longfellow Rd Unit 71530290
- 6 Longfellow Rd
- 8 South St
- 11 Batchelder Park
- 109 Pleasant St
- 107 Pleasant St