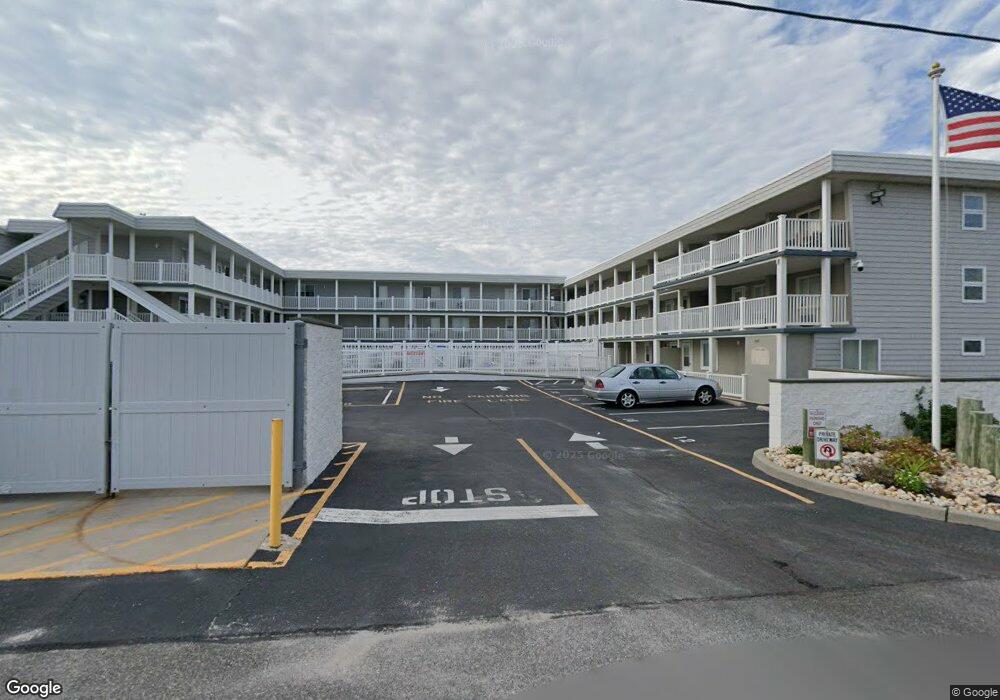
1 2nd Ave Unit 18 Seaside Heights, NJ 08751
Dover Beaches South NeighborhoodEstimated Value: $536,000 - $794,000
2
Beds
1
Bath
695
Sq Ft
$955/Sq Ft
Est. Value
About This Home
This home is located at 1 2nd Ave Unit 18, Seaside Heights, NJ 08751 and is currently estimated at $663,916, approximately $955 per square foot. 1 2nd Ave Unit 18 is a home located in Ocean County.
Ownership History
Date
Name
Owned For
Owner Type
Purchase Details
Closed on
Nov 5, 2019
Sold by
Hilly Megan and Hilly Christopher
Bought by
Smith Doreen Patricia
Current Estimated Value
Home Financials for this Owner
Home Financials are based on the most recent Mortgage that was taken out on this home.
Original Mortgage
$315,000
Outstanding Balance
$277,941
Interest Rate
3.75%
Mortgage Type
New Conventional
Estimated Equity
$385,975
Purchase Details
Closed on
Apr 20, 2012
Sold by
Hilly Megan and Hilly Christopher
Bought by
Hilly Megan
Home Financials for this Owner
Home Financials are based on the most recent Mortgage that was taken out on this home.
Original Mortgage
$340,550
Interest Rate
3.7%
Mortgage Type
New Conventional
Purchase Details
Closed on
May 4, 2007
Sold by
Ranieri Maurizio and Ranieri Rosemarie
Bought by
Healy Megan
Home Financials for this Owner
Home Financials are based on the most recent Mortgage that was taken out on this home.
Original Mortgage
$42,450
Interest Rate
6.21%
Mortgage Type
Purchase Money Mortgage
Create a Home Valuation Report for This Property
The Home Valuation Report is an in-depth analysis detailing your home's value as well as a comparison with similar homes in the area
Home Values in the Area
Average Home Value in this Area
Purchase History
| Date | Buyer | Sale Price | Title Company |
|---|---|---|---|
| Smith Doreen Patricia | $425,000 | First Choice Title Agency | |
| Hilly Megan | -- | Lsi Custom Recording Solutio | |
| Healy Megan | $425,000 | None Available |
Source: Public Records
Mortgage History
| Date | Status | Borrower | Loan Amount |
|---|---|---|---|
| Open | Smith Doreen Patricia | $315,000 | |
| Previous Owner | Hilly Megan | $340,550 | |
| Previous Owner | Healy Megan | $42,450 |
Source: Public Records
Tax History
| Year | Tax Paid | Tax Assessment Tax Assessment Total Assessment is a certain percentage of the fair market value that is determined by local assessors to be the total taxable value of land and additions on the property. | Land | Improvement |
|---|---|---|---|---|
| 2025 | $7,730 | $395,600 | $250,000 | $145,600 |
| 2024 | $6,848 | $395,600 | $250,000 | $145,600 |
| 2023 | $6,603 | $395,600 | $250,000 | $145,600 |
| 2022 | $6,603 | $395,600 | $250,000 | $145,600 |
| 2021 | $1,222 | $196,000 | $137,500 | $58,500 |
| 2020 | $4,888 | $196,000 | $137,500 | $58,500 |
| 2019 | $4,677 | $196,000 | $137,500 | $58,500 |
| 2018 | $5,175 | $196,000 | $137,500 | $58,500 |
| 2017 | $4,516 | $196,000 | $137,500 | $58,500 |
| 2016 | $4,455 | $196,000 | $137,500 | $58,500 |
| 2015 | $3,134 | $143,300 | $137,500 | $5,800 |
| 2014 | $2,984 | $143,300 | $137,500 | $5,800 |
Source: Public Records
Map
Nearby Homes
- 2 2nd Ave Unit 1
- 1935 Ocean Ave Unit 20
- 2000 New Jersey 35
- 2030 Route 35 N Unit C
- 2033 Route 35 Unit 3
- 15 7th Ave
- 209 1st Ave
- 116 Newark Ave
- 2052 Baltimore Ave
- 21 Jersey City Ave
- 1820 E Pennsylvania Ave Unit XX
- 2060 Route 35 S Unit 3
- 1807 Grand Central Ave Unit 2
- 99 Coolidge Ave
- 204 Coolidge Ave
- 1922 Bay Blvd
- 1920 Bay Blvd
- 1709 Route 35 N Unit 9
- 213 Harding Ave
- 11 Dune Terrace Unit 11
- 1 2nd Ave Unit 15
- 1 2nd Ave Unit 2
- 1 2nd Ave Unit 26
- 1 2nd Ave Unit 11
- 1 2nd Ave Unit 16
- 1 2nd Ave Unit 33
- 1 2nd Ave Unit 6
- 1 2nd Ave Unit 41
- 1 2nd Ave Unit 24
- 1 2nd Ave Unit 31
- 1 2nd Ave Unit 39
- 1 2nd Ave Unit 20
- 1 2nd Ave Unit 8
- 1 2nd Ave Unit 21
- 1 2nd Ave Unit SB
- 1 2nd Ave Unit 40
- 1 2nd Ave Unit 38
- 1 2nd Ave Unit 37
- 1 2nd Ave Unit 36
- 1 2nd Ave Unit 35
Your Personal Tour Guide
Ask me questions while you tour the home.