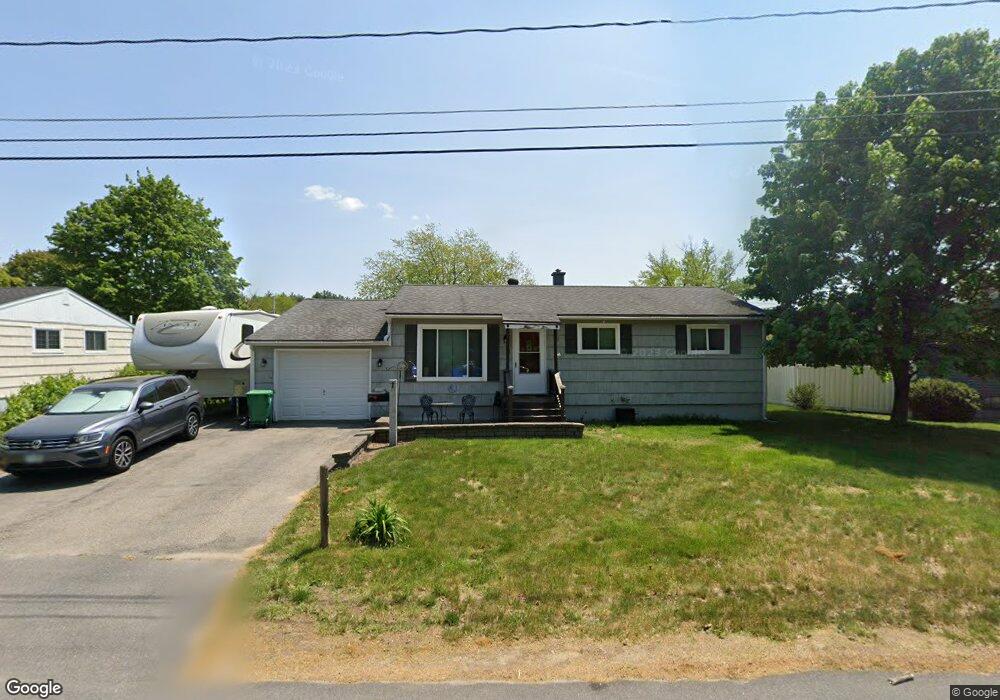
1 3rd St Rochester, NH 03867
Estimated Value: $312,779 - $365,000
4
Beds
1
Bath
1,518
Sq Ft
$220/Sq Ft
Est. Value
About This Home
This home is located at 1 3rd St, Rochester, NH 03867 and is currently estimated at $333,945, approximately $219 per square foot. 1 3rd St is a home located in Strafford County with nearby schools including Chamberlain Street School, Rochester Middle School, and Spaulding High School.
Ownership History
Date
Name
Owned For
Owner Type
Purchase Details
Closed on
Jan 11, 2010
Sold by
Us Bank Na Tr
Bought by
Simpson Leslie A and Simpson Jeffrey J
Current Estimated Value
Home Financials for this Owner
Home Financials are based on the most recent Mortgage that was taken out on this home.
Original Mortgage
$124,601
Outstanding Balance
$79,440
Interest Rate
4.78%
Mortgage Type
Purchase Money Mortgage
Estimated Equity
$254,505
Purchase Details
Closed on
Oct 14, 2009
Sold by
Cash Donna M and Us Bank Na Tr
Bought by
Us Bank Na Tr
Purchase Details
Closed on
Apr 18, 2006
Sold by
Dube Steven N and Dube Jennifer A
Bought by
Cash David A and Cash Donna M
Purchase Details
Closed on
Sep 19, 2003
Sold by
Baribeault Wayne J and Baribeault Hazel J
Bought by
Dube Steven N and Dube Jennifer A
Purchase Details
Closed on
Dec 10, 1996
Sold by
Saunders Norman and Saunders Annette M
Bought by
Nh Hsng Finance Auth
Create a Home Valuation Report for This Property
The Home Valuation Report is an in-depth analysis detailing your home's value as well as a comparison with similar homes in the area
Home Values in the Area
Average Home Value in this Area
Purchase History
| Date | Buyer | Sale Price | Title Company |
|---|---|---|---|
| Simpson Leslie A | $125,900 | -- | |
| Simpson Leslie A | $125,900 | -- | |
| Us Bank Na Tr | $116,900 | -- | |
| Us Bank Na Tr | $116,900 | -- | |
| Cash David A | $200,000 | -- | |
| Cash David A | $200,000 | -- | |
| Dube Steven N | $142,000 | -- | |
| Dube Steven N | $142,000 | -- | |
| Nh Hsng Finance Auth | $45,000 | -- | |
| Nh Hsng Finance Auth | $45,000 | -- |
Source: Public Records
Mortgage History
| Date | Status | Borrower | Loan Amount |
|---|---|---|---|
| Open | Nh Hsng Finance Auth | $124,601 | |
| Closed | Nh Hsng Finance Auth | $124,601 |
Source: Public Records
Tax History
| Year | Tax Paid | Tax Assessment Tax Assessment Total Assessment is a certain percentage of the fair market value that is determined by local assessors to be the total taxable value of land and additions on the property. | Land | Improvement |
|---|---|---|---|---|
| 2025 | $3,827 | $250,100 | $66,700 | $183,400 |
| 2024 | $3,714 | $250,100 | $66,700 | $183,400 |
| 2023 | $3,882 | $150,800 | $52,600 | $98,200 |
| 2022 | $3,812 | $150,800 | $52,600 | $98,200 |
| 2021 | $3,717 | $150,800 | $52,600 | $98,200 |
| 2020 | $3,716 | $151,000 | $52,600 | $98,400 |
| 2019 | $3,760 | $151,000 | $52,600 | $98,400 |
| 2018 | $3,737 | $135,800 | $39,500 | $96,300 |
| 2017 | $3,576 | $135,800 | $39,500 | $96,300 |
| 2016 | $3,323 | $117,600 | $39,500 | $78,100 |
| 2015 | $3,310 | $117,600 | $39,500 | $78,100 |
| 2014 | $3,230 | $117,600 | $39,500 | $78,100 |
| 2013 | $3,593 | $136,300 | $52,600 | $83,700 |
| 2012 | $3,500 | $136,300 | $52,600 | $83,700 |
Source: Public Records
Map
Nearby Homes
- 8 Adams Ave
- 0 Franklin St Unit 55 4959653
- 10 Sarah Ct
- 33 Linden St
- 20 Franklin Heights
- 16 Springfield Estates
- 15 Linden St
- 45 Hanson St
- 3 Dodge St
- 1 Brook St
- 2 Barker Ct
- 18 Wakefield St
- 43-45 Charles St
- 17-19 Upham St
- 0 Edgewood Ln
- 7 Collins Cir
- 87 Charles St Unit 2
- 68 Moose Ln
- 54 Harding St
- 46-48 Lafayette St
Your Personal Tour Guide
Ask me questions while you tour the home.