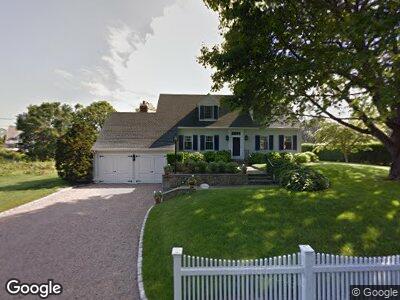
1 Arraquat Rd Westerly, RI 02891
Estimated Value: $3,525,000 - $4,901,000
4
Beds
3
Baths
2,860
Sq Ft
$1,471/Sq Ft
Est. Value
About This Home
This home is located at 1 Arraquat Rd, Westerly, RI 02891 and is currently estimated at $4,206,647, approximately $1,470 per square foot. 1 Arraquat Rd is a home located in Washington County with nearby schools including Westerly High School.
Ownership History
Date
Name
Owned For
Owner Type
Purchase Details
Closed on
Nov 10, 2022
Sold by
Harkins Peter C and Harkins Susan E
Bought by
Mestel Michael and Kulak Lisa
Current Estimated Value
Home Financials for this Owner
Home Financials are based on the most recent Mortgage that was taken out on this home.
Original Mortgage
$2,500,000
Outstanding Balance
$2,402,592
Interest Rate
4.25%
Mortgage Type
Purchase Money Mortgage
Estimated Equity
$1,921,556
Purchase Details
Closed on
Sep 12, 2008
Sold by
Ahern Ahern F and Ahern Joyce S
Bought by
Harkins Peter C
Create a Home Valuation Report for This Property
The Home Valuation Report is an in-depth analysis detailing your home's value as well as a comparison with similar homes in the area
Home Values in the Area
Average Home Value in this Area
Purchase History
| Date | Buyer | Sale Price | Title Company |
|---|---|---|---|
| Mestel Michael | $3,400,000 | None Available | |
| Harkins Peter C | $33,333,000 | -- |
Source: Public Records
Mortgage History
| Date | Status | Borrower | Loan Amount |
|---|---|---|---|
| Open | Mestel Michael | $2,500,000 | |
| Closed | Mestel Michael | $220,000 | |
| Previous Owner | Harkins Peter C | $1,000,000 |
Source: Public Records
Tax History Compared to Growth
Tax History
| Year | Tax Paid | Tax Assessment Tax Assessment Total Assessment is a certain percentage of the fair market value that is determined by local assessors to be the total taxable value of land and additions on the property. | Land | Improvement |
|---|---|---|---|---|
| 2024 | $33,557 | $3,420,700 | $3,069,000 | $351,700 |
| 2023 | $32,907 | $3,420,700 | $3,069,000 | $351,700 |
| 2022 | $32,702 | $3,420,700 | $3,069,000 | $351,700 |
| 2021 | $35,031 | $3,040,900 | $2,673,600 | $367,300 |
| 2020 | $34,393 | $3,040,900 | $2,673,600 | $367,300 |
| 2019 | $34,058 | $3,040,900 | $2,673,600 | $367,300 |
| 2018 | $30,366 | $2,556,100 | $2,301,700 | $254,400 |
| 2017 | $29,625 | $2,556,100 | $2,301,700 | $254,400 |
| 2016 | $29,855 | $2,556,100 | $2,301,700 | $254,400 |
| 2015 | $25,959 | $2,399,200 | $2,135,300 | $263,900 |
| 2014 | $25,527 | $2,399,200 | $2,135,300 | $263,900 |
Source: Public Records
Map
Nearby Homes
- 9 Arraquat Rd
- 38 Bay St Unit W201/202
- 38 Bay St Unit 402
- 44 Bay St Unit B105/B205
- 44 Bay St Unit 110
- 16 Yosemite Valley Rd
- 20 Browning Rd
- 24 Champlin Dr
- 50 Ocean View Hwy
- 60 Avondale Rd
- 6 Fox Run Run
- 43 Avondale Rd
- 37 Avondale Rd
- 0 Green Ave
- 22 Green Ave
- 82 Uzzi Ave
- 10 Tristam St
- 18 No Bottom Ridge Ridge
- 44 Benson Ave
- 464 Greenhaven Rd