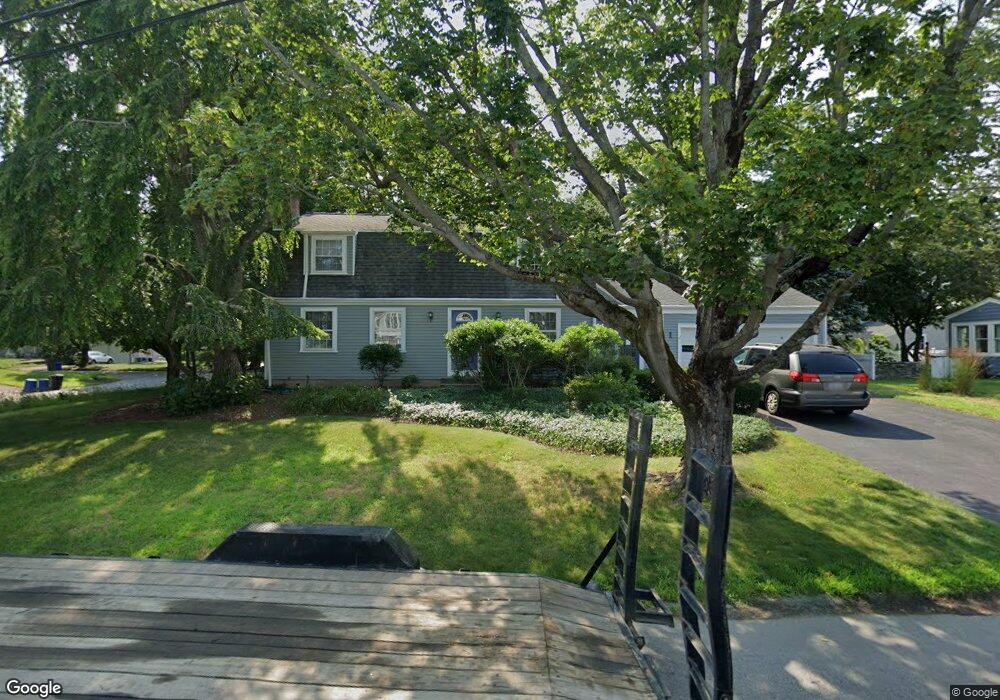
1 Blount Cir Barrington, RI 02806
Rumstick NeighborhoodEstimated Value: $997,836 - $1,154,000
4
Beds
2
Baths
1,746
Sq Ft
$618/Sq Ft
Est. Value
About This Home
This home is located at 1 Blount Cir, Barrington, RI 02806 and is currently estimated at $1,078,209, approximately $617 per square foot. 1 Blount Cir is a home located in Bristol County with nearby schools including Barrington High School, Barrington Christian Academy, and St. Andrews School.
Ownership History
Date
Name
Owned For
Owner Type
Purchase Details
Closed on
Nov 5, 2014
Sold by
Shea Lisa B and Shea Robert E
Bought by
Lisa B Shea T
Current Estimated Value
Purchase Details
Closed on
Aug 15, 1995
Sold by
Misch Gary S and Misch Patricia
Bought by
Shea Robert E and Shea Lisa
Purchase Details
Closed on
Mar 1, 1994
Sold by
Suresh Subra and Suresh Mary
Bought by
Misch Gary S and Misch Patricia
Purchase Details
Closed on
Sep 21, 1988
Sold by
Cowles Spencer
Bought by
Suresh Subramanian
Create a Home Valuation Report for This Property
The Home Valuation Report is an in-depth analysis detailing your home's value as well as a comparison with similar homes in the area
Home Values in the Area
Average Home Value in this Area
Purchase History
| Date | Buyer | Sale Price | Title Company |
|---|---|---|---|
| Lisa B Shea T | -- | -- | |
| Shea Robert E | $252,000 | -- | |
| Misch Gary S | $237,500 | -- | |
| Suresh Subramanian | $250,000 | -- | |
| Suresh Subramanian | $250,000 | -- |
Source: Public Records
Mortgage History
| Date | Status | Borrower | Loan Amount |
|---|---|---|---|
| Open | Suresh Subramanian | $100,000 | |
| Open | Suresh Subramanian | $167,700 |
Source: Public Records
Tax History Compared to Growth
Tax History
| Year | Tax Paid | Tax Assessment Tax Assessment Total Assessment is a certain percentage of the fair market value that is determined by local assessors to be the total taxable value of land and additions on the property. | Land | Improvement |
|---|---|---|---|---|
| 2025 | $12,379 | $807,000 | $424,000 | $383,000 |
| 2024 | $11,903 | $807,000 | $424,000 | $383,000 |
| 2023 | $11,165 | $550,000 | $247,000 | $303,000 |
| 2022 | $10,808 | $550,000 | $247,000 | $303,000 |
| 2021 | $10,533 | $550,000 | $247,000 | $303,000 |
| 2020 | $10,471 | $501,000 | $220,000 | $281,000 |
| 2019 | $10,070 | $501,000 | $220,000 | $281,000 |
| 2018 | $9,770 | $501,000 | $220,000 | $281,000 |
| 2017 | $9,872 | $493,600 | $217,100 | $276,500 |
| 2016 | $9,107 | $493,600 | $217,100 | $276,500 |
| 2015 | $9,008 | $493,600 | $217,100 | $276,500 |
| 2014 | $7,776 | $424,900 | $207,400 | $217,500 |
Source: Public Records
Map
Nearby Homes