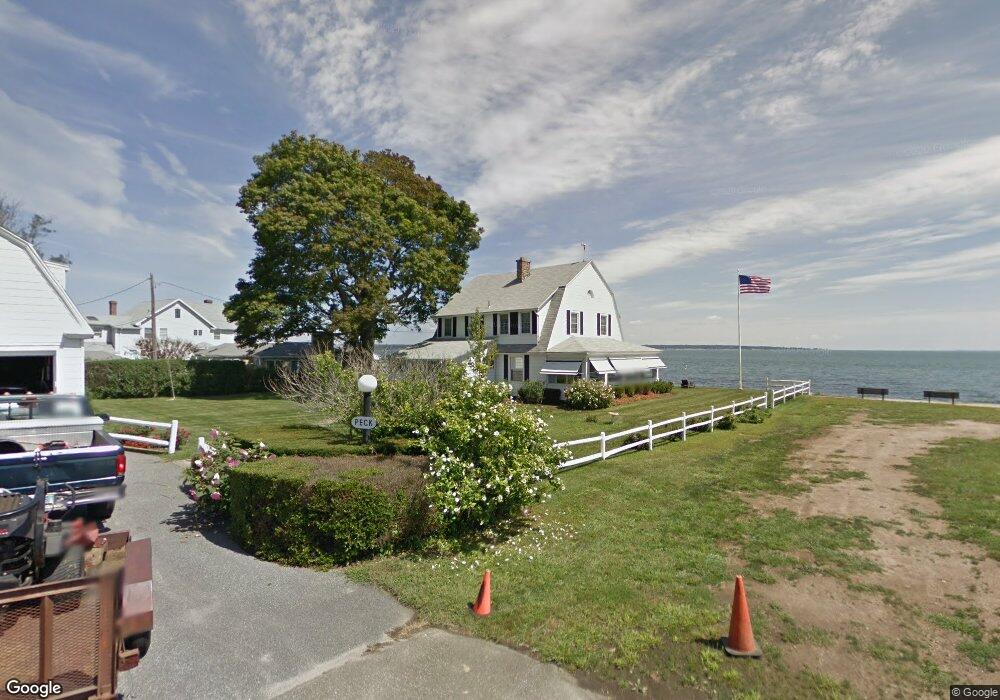
1 Blue Heron Ct Niantic, CT 06357
Estimated Value: $996,000 - $2,045,000
3
Beds
3
Baths
2,293
Sq Ft
$664/Sq Ft
Est. Value
About This Home
This home is located at 1 Blue Heron Ct, Niantic, CT 06357 and is currently estimated at $1,523,431, approximately $664 per square foot. 1 Blue Heron Ct is a home located in New London County with nearby schools including East Lyme Middle School and East Lyme High School.
Ownership History
Date
Name
Owned For
Owner Type
Purchase Details
Closed on
Mar 16, 2022
Sold by
Weiss David R and Weiss Sharon C
Bought by
Sharon C Weiss T C and Sharon Weiss
Current Estimated Value
Purchase Details
Closed on
Sep 27, 2018
Sold by
Weiss David and Weiss Sharon
Bought by
Weiss Sharon and Weiss David
Purchase Details
Closed on
Oct 6, 2017
Sold by
Peck Norman and Peck Ann
Bought by
Weiss David and Weidd Sharon
Create a Home Valuation Report for This Property
The Home Valuation Report is an in-depth analysis detailing your home's value as well as a comparison with similar homes in the area
Home Values in the Area
Average Home Value in this Area
Purchase History
| Date | Buyer | Sale Price | Title Company |
|---|---|---|---|
| Sharon C Weiss T C | -- | None Available | |
| Sharon C Weiss T | -- | None Available | |
| Weiss Sharon | -- | -- | |
| Weiss Sharon | -- | -- | |
| Weiss David | $830,000 | -- | |
| Weiss Sharon | -- | -- | |
| Weiss David | $830,000 | -- |
Source: Public Records
Mortgage History
| Date | Status | Borrower | Loan Amount |
|---|---|---|---|
| Previous Owner | Weiss David | $285,000 | |
| Previous Owner | Weiss David | $350,000 |
Source: Public Records
Tax History Compared to Growth
Tax History
| Year | Tax Paid | Tax Assessment Tax Assessment Total Assessment is a certain percentage of the fair market value that is determined by local assessors to be the total taxable value of land and additions on the property. | Land | Improvement |
|---|---|---|---|---|
| 2025 | $24,938 | $890,330 | $487,620 | $402,710 |
| 2024 | $23,460 | $890,330 | $487,620 | $402,710 |
| 2023 | $22,151 | $890,330 | $487,620 | $402,710 |
| 2022 | $21,225 | $890,330 | $487,620 | $402,710 |
| 2021 | $20,412 | $715,960 | $422,660 | $293,300 |
| 2020 | $20,305 | $715,960 | $422,660 | $293,300 |
| 2019 | $20,183 | $715,960 | $422,660 | $293,300 |
| 2018 | $14,889 | $544,390 | $422,660 | $121,730 |
| 2017 | $14,241 | $544,390 | $422,660 | $121,730 |
| 2016 | $13,879 | $547,260 | $422,660 | $124,600 |
| 2015 | $13,523 | $547,260 | $422,660 | $124,600 |
| 2014 | $13,151 | $547,260 | $422,660 | $124,600 |
Source: Public Records
Map
Nearby Homes
- 48 Billow Rd
- 11 Sunset Ave
- 43 Attawan Ave
- 5 Attawan Ave
- 46 Old Black Point Rd
- 23 Central Ave
- 127 Black Point Rd Unit 7
- 15 Griswold Rd
- 68-70 Black Point Rd
- 223 Giants Neck Rd
- 9 Columbus Ave
- 43 Village Crossing Unit 43
- 47 Village Crossing Unit 47
- 78 Corey Ln Unit 9
- 3 Pattagansett Ct
- 46 Village Crossing Unit 46
- 48 Village Crossing Unit 48
- 38 Hope St Unit 1307
- 38 Hope St Unit 1206
- 55 Corey Ln