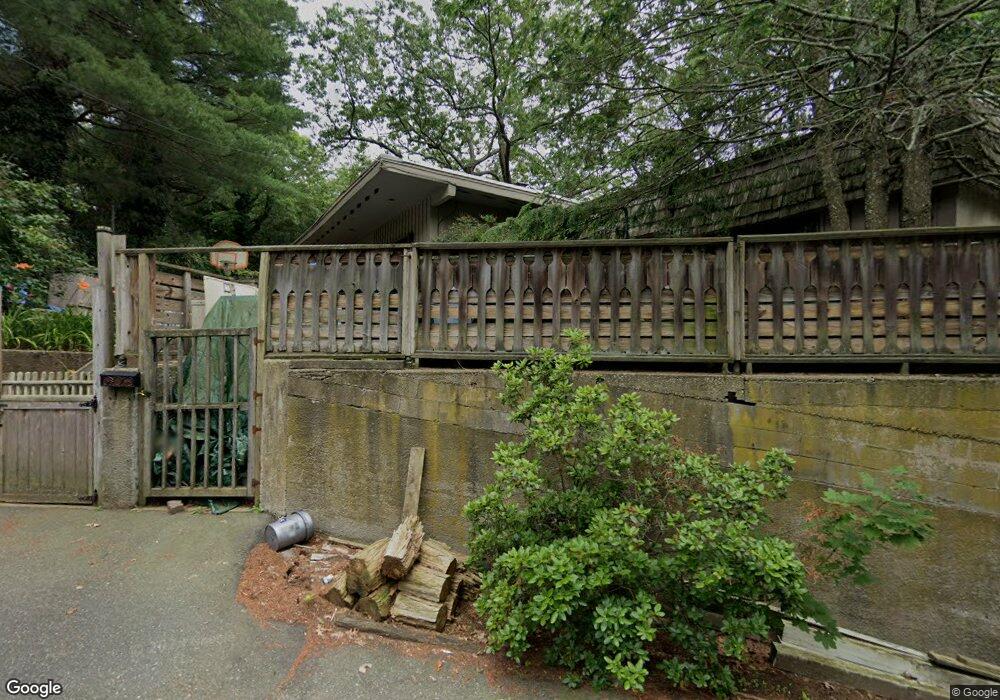
1 Border Rd Natick, MA 01760
Estimated Value: $644,000 - $946,000
3
Beds
2
Baths
1,662
Sq Ft
$509/Sq Ft
Est. Value
About This Home
This home is located at 1 Border Rd, Natick, MA 01760 and is currently estimated at $845,327, approximately $508 per square foot. 1 Border Rd is a home located in Middlesex County with nearby schools including Natick High School, Lilja Elementary School, and Wilson Middle School.
Ownership History
Date
Name
Owned For
Owner Type
Purchase Details
Closed on
Aug 29, 1997
Sold by
Edward A Herosian Ret
Bought by
Barr David A and Barr Roberta
Current Estimated Value
Home Financials for this Owner
Home Financials are based on the most recent Mortgage that was taken out on this home.
Original Mortgage
$159,600
Outstanding Balance
$24,603
Interest Rate
7.41%
Mortgage Type
Purchase Money Mortgage
Estimated Equity
$820,724
Create a Home Valuation Report for This Property
The Home Valuation Report is an in-depth analysis detailing your home's value as well as a comparison with similar homes in the area
Home Values in the Area
Average Home Value in this Area
Purchase History
| Date | Buyer | Sale Price | Title Company |
|---|---|---|---|
| Barr David A | $199,500 | -- |
Source: Public Records
Mortgage History
| Date | Status | Borrower | Loan Amount |
|---|---|---|---|
| Open | Barr David A | $159,600 | |
| Previous Owner | Barr David A | $50,000 |
Source: Public Records
Tax History
| Year | Tax Paid | Tax Assessment Tax Assessment Total Assessment is a certain percentage of the fair market value that is determined by local assessors to be the total taxable value of land and additions on the property. | Land | Improvement |
|---|---|---|---|---|
| 2025 | $4,825 | $403,400 | $333,400 | $70,000 |
| 2024 | $4,655 | $379,700 | $313,800 | $65,900 |
| 2023 | $4,596 | $363,600 | $302,000 | $61,600 |
| 2022 | $4,412 | $330,700 | $274,600 | $56,100 |
| 2021 | $5,591 | $460,500 | $258,900 | $201,600 |
| 2020 | $5,259 | $448,700 | $247,100 | $201,600 |
| 2019 | $5,703 | $448,700 | $247,100 | $201,600 |
| 2018 | $5,294 | $405,700 | $235,400 | $170,300 |
| 2017 | $4,676 | $367,200 | $200,000 | $167,200 |
| 2016 | $4,592 | $338,400 | $172,800 | $165,600 |
| 2015 | $4,490 | $324,900 | $172,800 | $152,100 |
Source: Public Records
Map
Nearby Homes
- 27 Border Rd
- 3 Macarthur Rd
- 10 Oak St
- 5 Bass Terrace
- 4 Shore Rd
- 52 Bacon St
- 31 College Rd
- 7 Westwood Rd
- 200 Pond Rd
- 925 Worcester St
- 37 Longfellow Rd
- 34 Marion St
- 12 Russell Rd Unit 404
- 53 Harvard Street Extension
- 27 Garrison Rd
- 48 Patton Rd
- 3 Vale St Unit A
- 38 Parker Rd
- 1 Sunnyside Ave
- 16 Sunnyside Ave
Your Personal Tour Guide
Ask me questions while you tour the home.