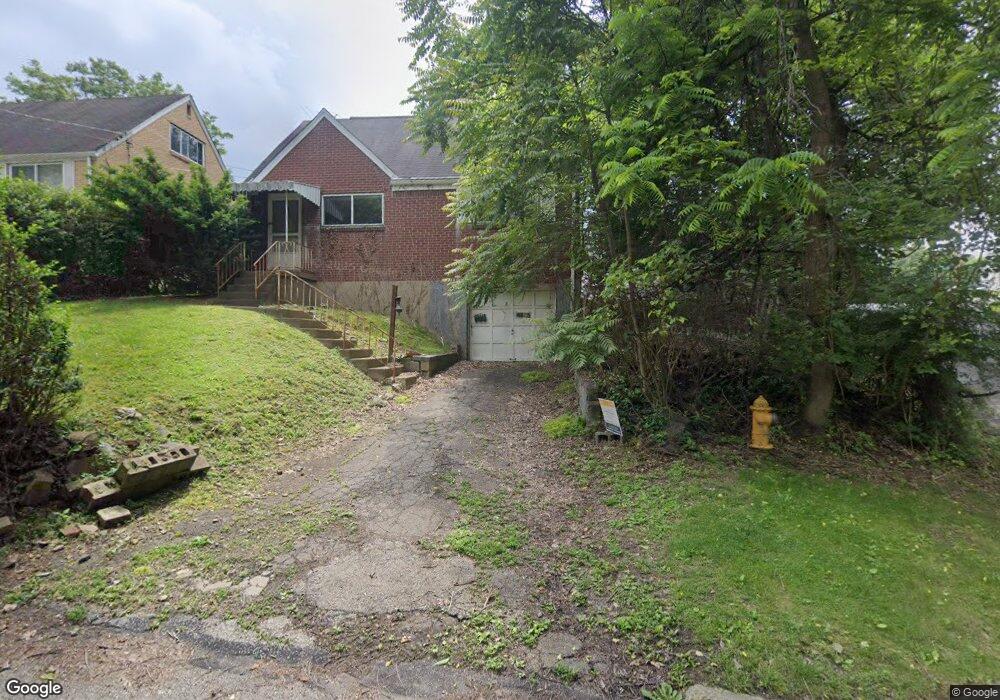
1 Bottomfield St Pittsburgh, PA 15223
Estimated Value: $168,000 - $206,000
2
Beds
2
Baths
1,080
Sq Ft
$174/Sq Ft
Est. Value
About This Home
This home is located at 1 Bottomfield St, Pittsburgh, PA 15223 and is currently estimated at $187,963, approximately $174 per square foot. 1 Bottomfield St is a home located in Allegheny County with nearby schools including Marzolf Primary School, Shaler Area Elementary School, and Shaler Area Middle School.
Ownership History
Date
Name
Owned For
Owner Type
Purchase Details
Closed on
Jul 12, 2021
Sold by
Tri-Cog Land Bank
Bought by
City Of Bridges Clt
Current Estimated Value
Purchase Details
Closed on
Jan 7, 2019
Sold by
Barto Norma J
Bought by
Tri & Cog Land Bank
Purchase Details
Closed on
Mar 12, 1959
Bought by
Barto William H and Barto Norma J
Create a Home Valuation Report for This Property
The Home Valuation Report is an in-depth analysis detailing your home's value as well as a comparison with similar homes in the area
Home Values in the Area
Average Home Value in this Area
Purchase History
| Date | Buyer | Sale Price | Title Company |
|---|---|---|---|
| City Of Bridges Clt | $16,500 | -- | |
| City Bridges C L T | -- | None Available | |
| Tri & Cog Land Bank | $217,773 | None Available | |
| Barto William H | -- | -- |
Source: Public Records
Tax History Compared to Growth
Tax History
| Year | Tax Paid | Tax Assessment Tax Assessment Total Assessment is a certain percentage of the fair market value that is determined by local assessors to be the total taxable value of land and additions on the property. | Land | Improvement |
|---|---|---|---|---|
| 2025 | $3,440 | $89,500 | $23,200 | $66,300 |
| 2024 | $3,440 | $89,500 | $23,200 | $66,300 |
| 2023 | $3,335 | $89,500 | $23,200 | $66,300 |
| 2022 | $3,335 | $89,500 | $23,200 | $66,300 |
| 2021 | $3,335 | $89,500 | $23,200 | $66,300 |
| 2020 | $3,335 | $89,500 | $23,200 | $66,300 |
| 2019 | $2,664 | $71,500 | $23,200 | $48,300 |
| 2018 | $237 | $71,500 | $23,200 | $48,300 |
| 2017 | $2,541 | $71,500 | $23,200 | $48,300 |
| 2016 | $338 | $71,500 | $23,200 | $48,300 |
| 2015 | $338 | $71,500 | $23,200 | $48,300 |
| 2014 | $2,454 | $71,500 | $23,200 | $48,300 |
Source: Public Records
Map
Nearby Homes