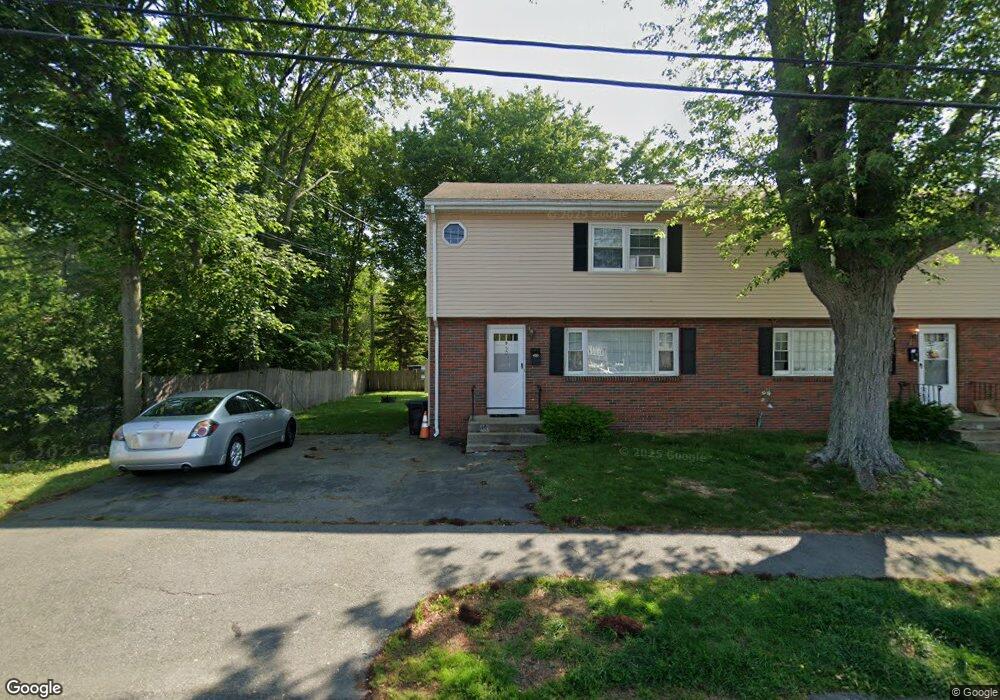
1 Brassie Way Peabody, MA 01960
South Peabody NeighborhoodEstimated Value: $917,890 - $1,135,000
4
Beds
3
Baths
2,786
Sq Ft
$360/Sq Ft
Est. Value
About This Home
This home is located at 1 Brassie Way, Peabody, MA 01960 and is currently estimated at $1,001,973, approximately $359 per square foot. 1 Brassie Way is a home located in Essex County with nearby schools including Peabody Veterans Memorial High School, St John The Baptist School, and The Phoenix School.
Ownership History
Date
Name
Owned For
Owner Type
Purchase Details
Closed on
Sep 28, 2011
Sold by
Collins Melanee M
Bought by
Wozniak Adam C
Current Estimated Value
Home Financials for this Owner
Home Financials are based on the most recent Mortgage that was taken out on this home.
Original Mortgage
$409,160
Interest Rate
4.25%
Mortgage Type
FHA
Create a Home Valuation Report for This Property
The Home Valuation Report is an in-depth analysis detailing your home's value as well as a comparison with similar homes in the area
Home Values in the Area
Average Home Value in this Area
Purchase History
| Date | Buyer | Sale Price | Title Company |
|---|---|---|---|
| Wozniak Adam C | $424,000 | -- |
Source: Public Records
Mortgage History
| Date | Status | Borrower | Loan Amount |
|---|---|---|---|
| Open | Wozniak Adam C | $405,000 | |
| Closed | Wozniak Adam C | $409,160 | |
| Previous Owner | Wozniak Adam C | $265,000 |
Source: Public Records
Tax History Compared to Growth
Tax History
| Year | Tax Paid | Tax Assessment Tax Assessment Total Assessment is a certain percentage of the fair market value that is determined by local assessors to be the total taxable value of land and additions on the property. | Land | Improvement |
|---|---|---|---|---|
| 2025 | $8,348 | $901,500 | $230,200 | $671,300 |
| 2024 | $7,163 | $785,400 | $230,200 | $555,200 |
| 2023 | $7,358 | $772,900 | $205,600 | $567,300 |
| 2022 | $6,778 | $671,100 | $183,600 | $487,500 |
| 2021 | $6,565 | $625,800 | $167,000 | $458,800 |
| 2020 | $6,542 | $609,100 | $167,000 | $442,100 |
| 2019 | $6,145 | $558,100 | $167,000 | $391,100 |
| 2018 | $5,889 | $513,900 | $151,700 | $362,200 |
| 2017 | $6,085 | $517,400 | $151,700 | $365,700 |
| 2016 | $5,942 | $498,500 | $151,700 | $346,800 |
| 2015 | $5,117 | $416,000 | $148,000 | $268,000 |
Source: Public Records
Map
Nearby Homes
- 60 Lynn St
- 19 Cedar Grove Ave
- 111 Foster St Unit 416
- 111 Foster St Unit 401
- 20 State St
- 2 Rose Cir
- 159 Marlborough Rd
- 13 State St
- 30 Saint Ann's Ave
- 32 Mason St
- 176 Marlborough Rd
- 12 Sutton St
- 2 Ethel Ave Unit 2
- 16 Ethel Ave
- 5 Quarry Terrace
- 70 Marlborough Rd
- 10 Elliott Place Unit 1R
- 41 Dexter St
- 38-1/2 Ellsworth Rd
- 21 Chanelle Cir