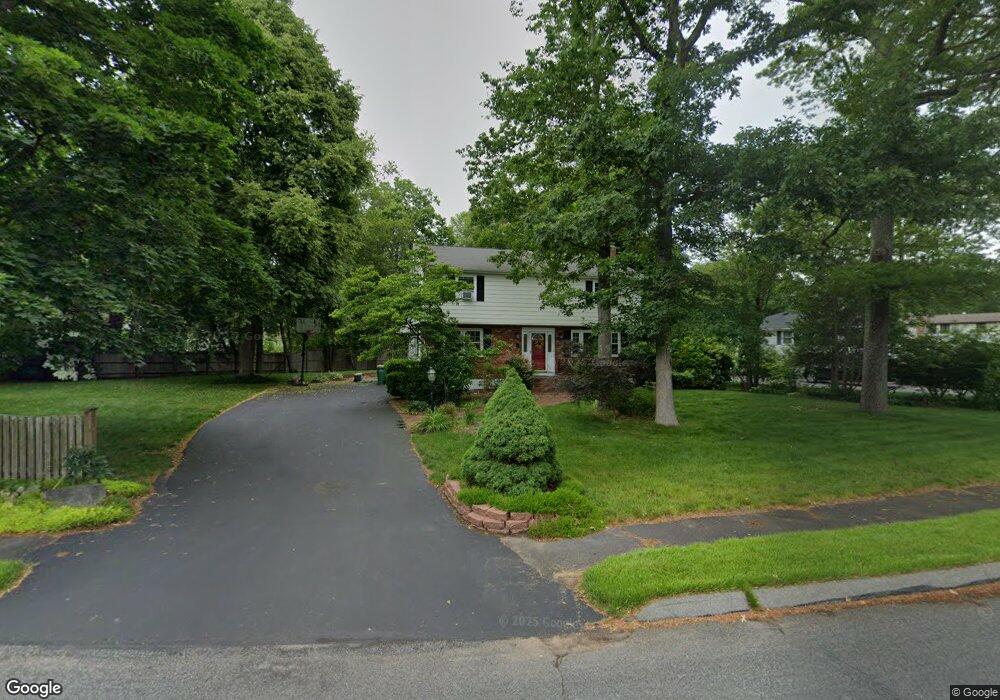
1 Brookside Rd Mansfield, MA 02048
Estimated Value: $646,000 - $789,000
4
Beds
2
Baths
1,872
Sq Ft
$378/Sq Ft
Est. Value
About This Home
This home is located at 1 Brookside Rd, Mansfield, MA 02048 and is currently estimated at $707,793, approximately $378 per square foot. 1 Brookside Rd is a home located in Bristol County with nearby schools including Everett W. Robinson Elementary School, Jordan/Jackson Elementary School, and Harold L. Qualters Middle School.
Ownership History
Date
Name
Owned For
Owner Type
Purchase Details
Closed on
Oct 12, 2025
Sold by
Jeans Charles and Jeans Mary E
Bought by
2025 Jean Ft and Jean
Current Estimated Value
Purchase Details
Closed on
Apr 30, 2008
Sold by
Jacques Cynthia and Jacques Matthew S
Bought by
Jeans Charles and Jeans Mary E
Home Financials for this Owner
Home Financials are based on the most recent Mortgage that was taken out on this home.
Original Mortgage
$296,000
Interest Rate
5.99%
Mortgage Type
Purchase Money Mortgage
Purchase Details
Closed on
Aug 1, 2001
Sold by
Tullis Robert and Tullis Joseph P
Bought by
Jacques Matthew and Burnham Cynthia A
Purchase Details
Closed on
Nov 17, 2000
Sold by
Mohan John and Ocwen Federal Bank Fsb
Bought by
Tullis Robert and Clance Joseph P
Create a Home Valuation Report for This Property
The Home Valuation Report is an in-depth analysis detailing your home's value as well as a comparison with similar homes in the area
Home Values in the Area
Average Home Value in this Area
Purchase History
We collect this data history from publicly available records. To have your information removed, we recommend requesting removal directly through your county’s website.
| Date | Buyer | Sale Price | Title Company |
|---|---|---|---|
| 2025 Jean Ft | -- | -- | |
| Jeans Charles | $370,000 | -- | |
| Jeans Charles E | $370,000 | -- | |
| Jacques Matthew | $264,000 | -- | |
| Tullis Robert | $226,000 | -- |
Source: Public Records
Mortgage History
We collect this data history from publicly available records. To have your information removed, we recommend requesting removal directly through your county’s website.
| Date | Status | Borrower | Loan Amount |
|---|---|---|---|
| Previous Owner | Jeans Charles E | $296,000 |
Source: Public Records
Tax History
| Year | Tax Paid | Tax Assessment Tax Assessment Total Assessment is a certain percentage of the fair market value that is determined by local assessors to be the total taxable value of land and additions on the property. | Land | Improvement |
|---|---|---|---|---|
| 2025 | $7,374 | $559,900 | $254,300 | $305,600 |
| 2024 | $6,970 | $516,300 | $242,700 | $273,600 |
| 2023 | $6,790 | $481,900 | $242,700 | $239,200 |
| 2022 | $6,546 | $431,500 | $224,700 | $206,800 |
| 2021 | $3,979 | $423,100 | $214,100 | $209,000 |
| 2020 | $3,364 | $390,700 | $187,300 | $203,400 |
| 2019 | $5,960 | $391,600 | $178,300 | $213,300 |
| 2018 | $2,814 | $379,300 | $169,900 | $209,400 |
| 2017 | $2,796 | $368,600 | $164,900 | $203,700 |
| 2016 | $5,321 | $345,300 | $156,900 | $188,400 |
| 2015 | $5,205 | $335,800 | $156,900 | $178,900 |
Source: Public Records
Map
Nearby Homes
- 1125 School St
- 174 Gilbert St
- 85 Jewell St
- 14 Lancelot Ln
- 238 N Worcester St
- 100 Lakeview Ave
- 343 Godfrey Dr
- 49 Pheasant Hill Rd
- 162 Godfrey Dr Unit 162
- 42 Colts Way
- 26 Pinto Way
- 179 Dean St
- 5 Juniper Dr
- 1 Great Woods Cir
- 3 Morse Ct
- 361 Richardson Ave
- 19 Barberry Rd
- 139 Grove St
- 69 Union St
- 10 Anna Way
Your Personal Tour Guide
Ask me questions while you tour the home.