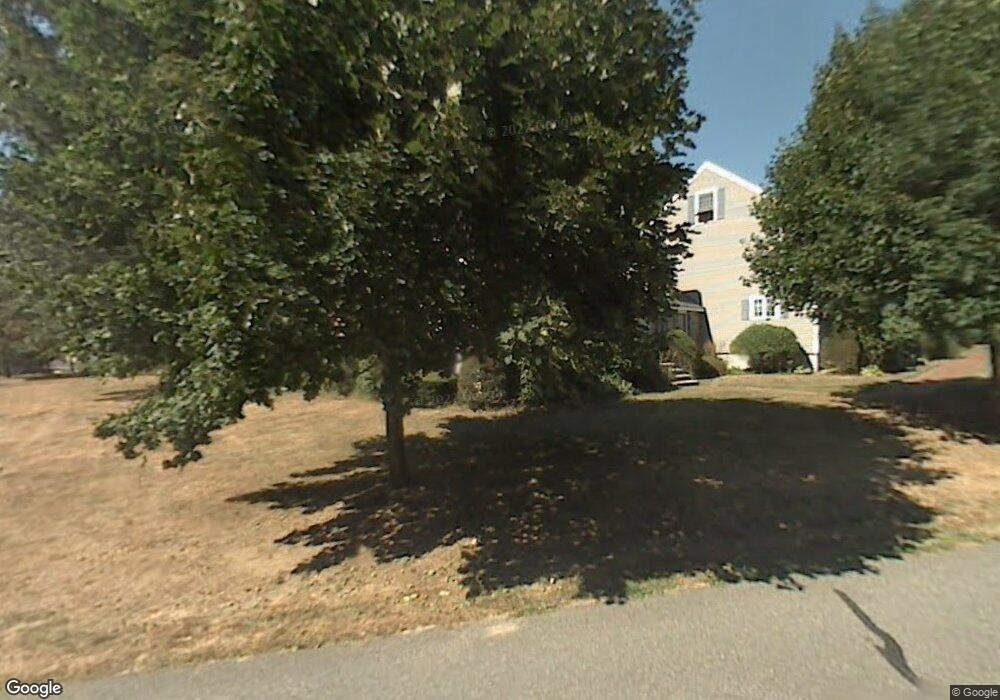
1 Captain Cook Way Plaistow, NH 03865
Estimated Value: $363,000 - $422,000
2
Beds
2
Baths
1,389
Sq Ft
$282/Sq Ft
Est. Value
About This Home
This home is located at 1 Captain Cook Way, Plaistow, NH 03865 and is currently estimated at $391,750, approximately $282 per square foot. 1 Captain Cook Way is a home located in Rockingham County with nearby schools including Pollard Elementary School, Timberlane Regional Middle School, and Timberlane Regional High School.
Ownership History
Date
Name
Owned For
Owner Type
Purchase Details
Closed on
Sep 17, 2024
Sold by
Conroy Christopher E and Goodwin Margaret V
Bought by
Conroy Ft and Conroy
Current Estimated Value
Purchase Details
Closed on
Jan 14, 2021
Sold by
1541 Ecr Rt and Goodwin
Bought by
Conroy Christopher E and Goodwin Margaret V
Purchase Details
Closed on
Dec 11, 2015
Sold by
Burns Carey C
Bought by
1541 Ecr Rt and Goodwin
Purchase Details
Closed on
Apr 2, 2013
Sold by
Taylor Linda
Bought by
Burns Carey C and Giarrusso Gina
Purchase Details
Closed on
Jul 19, 2006
Sold by
Dargoonian Dena L
Bought by
Taylor John and Taylor Linda
Home Financials for this Owner
Home Financials are based on the most recent Mortgage that was taken out on this home.
Original Mortgage
$141,500
Interest Rate
6.67%
Mortgage Type
Purchase Money Mortgage
Create a Home Valuation Report for This Property
The Home Valuation Report is an in-depth analysis detailing your home's value as well as a comparison with similar homes in the area
Home Values in the Area
Average Home Value in this Area
Purchase History
| Date | Buyer | Sale Price | Title Company |
|---|---|---|---|
| Conroy Ft | -- | None Available | |
| Conroy Ft | -- | None Available | |
| Conroy Ft | -- | None Available | |
| Conroy Ft | -- | None Available | |
| Conroy Christopher E | $255,000 | None Available | |
| Conroy Christopher E | $255,000 | None Available | |
| Conroy Christopher E | $255,000 | None Available | |
| 1541 Ecr Rt | $226,000 | -- | |
| 1541 Ecr Rt | $226,000 | -- | |
| 1541 Ecr Rt | $226,000 | -- | |
| Burns Carey C | $186,700 | -- | |
| Burns Carey C | $186,700 | -- | |
| Taylor John | $246,500 | -- | |
| Taylor John | $246,500 | -- |
Source: Public Records
Mortgage History
| Date | Status | Borrower | Loan Amount |
|---|---|---|---|
| Previous Owner | Taylor John | $181,111 | |
| Previous Owner | Taylor John | $170,000 | |
| Previous Owner | Taylor John | $141,500 |
Source: Public Records
Tax History Compared to Growth
Tax History
| Year | Tax Paid | Tax Assessment Tax Assessment Total Assessment is a certain percentage of the fair market value that is determined by local assessors to be the total taxable value of land and additions on the property. | Land | Improvement |
|---|---|---|---|---|
| 2024 | $5,969 | $288,100 | $0 | $288,100 |
| 2023 | $6,436 | $288,100 | $0 | $288,100 |
| 2022 | $5,477 | $288,100 | $0 | $288,100 |
| 2021 | $5,462 | $288,100 | $0 | $288,100 |
| 2020 | $5,495 | $253,800 | $15,000 | $238,800 |
| 2019 | $5,408 | $253,800 | $15,000 | $238,800 |
| 2018 | $5,179 | $210,600 | $25,000 | $185,600 |
| 2017 | $5,046 | $210,600 | $25,000 | $185,600 |
| 2016 | $4,739 | $210,600 | $25,000 | $185,600 |
| 2015 | $4,897 | $202,700 | $40,000 | $162,700 |
| 2014 | $4,606 | $183,300 | $40,000 | $143,300 |
| 2011 | $4,507 | $182,400 | $40,000 | $142,400 |
Source: Public Records
Map
Nearby Homes
- 18 Horizon Way
- 17 Horizon Way
- 55 Sweet Hill Rd
- 6 Palmer Ave
- 15 Canterbury Forest Unit B
- 2 Major Ln
- 1 Elm St
- 28 Forrest St
- 34 Bel's Way
- 207 Oak Ridge Rd
- 5 Whiton Place
- 3 W Pine St Unit 4
- 98 Sweet Hill Rd
- 28 Westville Rd
- 15 Autumn Cir Unit A
- 120 Newton Rd Unit 2D
- 48 Westville Rd Unit 2-5
- 54 Westville Rd Unit 12
- 1 White Cedar Way Unit 1
- 135 Forrest St Unit 10
- 1 Captain Cook Way Unit 1
- 17 Cifre Ln
- 16 Cifre Ln
- 16 Seaver Brook Ln
- 7 Cifre Ln
- 20 Captain Cook Way Unit 20
- 17 Captain Cook Way
- 19 Cifre Ln
- 6 Cifre Ln
- 15 Seaver Brook Ln
- 5 Cifre Ln
- 17 Seaver Brook Ln
- 20 Seaver Brook Ln
- 19 Seaver Brook Ln Unit 19
- 25 Seaver Brook Ln
- 23 Seaver Brook Ln
- 21 Seaver Brook Ln
- 22 Seaver Brook Ln
- 28 Seaver Brook Ln Unit 28
- 28 Seaver Brook Ln