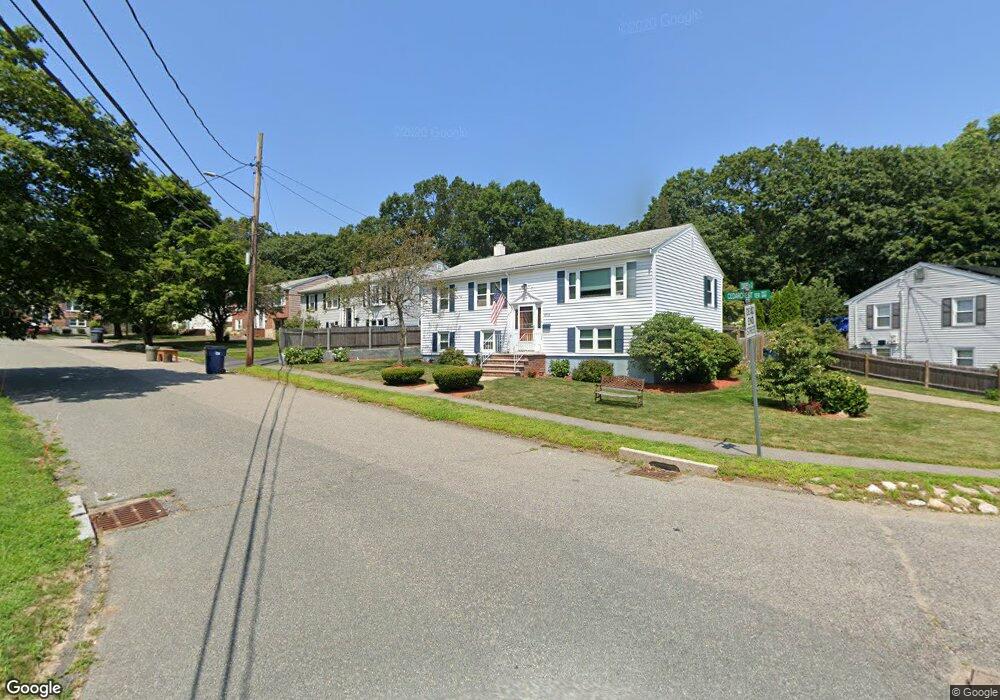
1 Cedarcrest Terrace West Roxbury, MA 02132
Upper Washington-Spring Street NeighborhoodEstimated Value: $702,839 - $773,000
3
Beds
2
Baths
1,726
Sq Ft
$432/Sq Ft
Est. Value
About This Home
This home is located at 1 Cedarcrest Terrace, West Roxbury, MA 02132 and is currently estimated at $744,960, approximately $431 per square foot. 1 Cedarcrest Terrace is a home located in Suffolk County with nearby schools including St Theresa School and The Roxbury Latin School.
Ownership History
Date
Name
Owned For
Owner Type
Purchase Details
Closed on
Mar 6, 2025
Sold by
Turgeon Louise M
Bought by
Louise Marie Turgeonj Lt and Turgeon
Current Estimated Value
Purchase Details
Closed on
Sep 8, 2023
Sold by
Rober Sayer Whitcher Lt and Turgeon
Bought by
Turgeon Louise M and Whitcher Robert S
Purchase Details
Closed on
Aug 26, 2021
Sold by
Whitcher Robert S
Bought by
Robert Sayer Whitcher Lt and Whitcher
Purchase Details
Closed on
Oct 22, 1991
Sold by
Kizino Sophie H
Bought by
Whitcher Robert S and Turgeon Louise M
Home Financials for this Owner
Home Financials are based on the most recent Mortgage that was taken out on this home.
Original Mortgage
$139,500
Interest Rate
9.06%
Mortgage Type
Purchase Money Mortgage
Create a Home Valuation Report for This Property
The Home Valuation Report is an in-depth analysis detailing your home's value as well as a comparison with similar homes in the area
Home Values in the Area
Average Home Value in this Area
Purchase History
| Date | Buyer | Sale Price | Title Company |
|---|---|---|---|
| Louise Marie Turgeonj Lt | -- | None Available | |
| Louise Marie Turgeonj Lt | -- | None Available | |
| Turgeon Louise M | -- | None Available | |
| Turgeon Louise M | -- | None Available | |
| Robert Sayer Whitcher Lt | -- | None Available | |
| Robert Sayer Whitcher Lt | -- | None Available | |
| Whitcher Robert S | $155,000 | -- | |
| Whitcher Robert S | $155,000 | -- |
Source: Public Records
Mortgage History
| Date | Status | Borrower | Loan Amount |
|---|---|---|---|
| Previous Owner | Whitcher Robert S | $65,000 | |
| Previous Owner | Whitcher Robert S | $142,500 | |
| Previous Owner | Whitcher Robert S | $139,500 |
Source: Public Records
Tax History Compared to Growth
Tax History
| Year | Tax Paid | Tax Assessment Tax Assessment Total Assessment is a certain percentage of the fair market value that is determined by local assessors to be the total taxable value of land and additions on the property. | Land | Improvement |
|---|---|---|---|---|
| 2025 | $6,506 | $561,800 | $246,500 | $315,300 |
| 2024 | $6,005 | $550,900 | $251,700 | $299,200 |
| 2023 | $5,636 | $524,800 | $239,800 | $285,000 |
| 2022 | $5,287 | $485,900 | $222,000 | $263,900 |
| 2021 | $4,774 | $447,400 | $209,400 | $238,000 |
| 2020 | $4,446 | $421,000 | $194,900 | $226,100 |
| 2019 | $3,942 | $374,000 | $143,600 | $230,400 |
| 2018 | $3,731 | $356,000 | $143,600 | $212,400 |
| 2017 | $3,695 | $348,900 | $143,600 | $205,300 |
| 2016 | $3,727 | $338,800 | $143,600 | $195,200 |
| 2015 | $3,796 | $313,500 | $125,700 | $187,800 |
| 2014 | $3,683 | $292,800 | $125,700 | $167,100 |
Source: Public Records
Map
Nearby Homes
- 45 Weymouth Ave
- 4959 Washington St
- 4975 Washington St Unit 311
- 10 Starling St
- 11 Cheriton Rd Unit 102B
- 14 Starling St
- 15 Starling St
- 35 Heron St
- 4873 Washington St Unit 1
- 50 Heron St
- 150 Grove St
- 12 Eagle St
- 115 Grove St Unit 11
- 111 Grove St Unit 6
- 5245 Washington St Unit 5
- 70 Birchwood St
- 42 Raldne Rd Unit 1
- 55 Cottage Rd
- 94 Rockland St
- 57 Rockland St
- 80 Cedarcrest Rd
- 5 Cedarcrest Terrace
- 70 Cedarcrest Rd
- 77 Cedarcrest Rd
- 73 Cedarcrest Rd
- 9 Cedarcrest Terrace
- 84 Cedarcrest Rd
- 6 Cedarcrest Terrace
- 66 Cedarcrest Rd
- 69 Cedarcrest Rd
- 81 Cedarcrest Rd
- 15 Cedarcrest Terrace
- 65 Cedarcrest Rd
- 14 Cedarcrest Rd
- 14 Cedarcrest Rd Unit 1
- 62 Cedarcrest Rd
- 10 Cedarcrest Terrace
- 19 Cedarcrest Terrace
- 61 Cedarcrest Rd
- 14 Cedarcrest Terrace