Estimated Value: $176,146 - $207,000
--
Bed
--
Bath
1,415
Sq Ft
$135/Sq Ft
Est. Value
About This Home
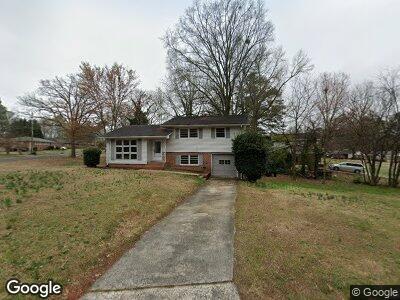
This home is located at 1 Chief Vann Dr SW, Rome, GA 30165 and is currently estimated at $191,537, approximately $135 per square foot. 1 Chief Vann Dr SW is a home located in Floyd County with nearby schools including Rome High School.
Ownership History
Date
Name
Owned For
Owner Type
Purchase Details
Closed on
Sep 5, 2006
Sold by
Not Provided
Bought by
Montgomery Montgomery Brent K Brent K and Montgomery Dieni L
Current Estimated Value
Home Financials for this Owner
Home Financials are based on the most recent Mortgage that was taken out on this home.
Original Mortgage
$84,000
Interest Rate
6.52%
Mortgage Type
New Conventional
Purchase Details
Closed on
May 8, 1995
Bought by
Dye Jack M and Barbara Dye
Create a Home Valuation Report for This Property
The Home Valuation Report is an in-depth analysis detailing your home's value as well as a comparison with similar homes in the area
Home Values in the Area
Average Home Value in this Area
Purchase History
| Date | Buyer | Sale Price | Title Company |
|---|---|---|---|
| Montgomery Montgomery Brent K Brent K | $93,000 | -- | |
| Dye Jack M | -- | -- |
Source: Public Records
Mortgage History
| Date | Status | Borrower | Loan Amount |
|---|---|---|---|
| Closed | Montgomery Montgomery Brent K Brent K | $84,000 | |
| Previous Owner | Dye Jack M | $72,500 |
Source: Public Records
Tax History Compared to Growth
Tax History
| Year | Tax Paid | Tax Assessment Tax Assessment Total Assessment is a certain percentage of the fair market value that is determined by local assessors to be the total taxable value of land and additions on the property. | Land | Improvement |
|---|---|---|---|---|
| 2024 | $2,073 | $58,538 | $14,337 | $44,201 |
| 2023 | $2,073 | $55,261 | $12,950 | $42,311 |
| 2022 | $1,654 | $45,337 | $10,637 | $34,700 |
| 2021 | $1,426 | $38,443 | $10,637 | $27,806 |
| 2020 | $1,280 | $34,199 | $8,094 | $26,105 |
| 2019 | $1,201 | $32,452 | $8,094 | $24,358 |
| 2018 | $1,065 | $28,773 | $8,094 | $20,679 |
| 2017 | $1,005 | $27,138 | $8,094 | $19,044 |
| 2016 | $1,102 | $29,680 | $8,080 | $21,600 |
| 2015 | $1,176 | $29,680 | $8,080 | $21,600 |
| 2014 | $1,176 | $29,680 | $8,080 | $21,600 |
Source: Public Records
Map
Nearby Homes
- 11 Chief Vann Dr SW
- 216 Coosawattee Ave SW
- 105 Chief Vann Dr SW
- 610 Kingfisher Cir SW
- 115 Echota Cir SW
- 129 John Ross Dr SW
- 0 Westlyn Dr Unit 10373508
- 0 Westlyn Dr Unit 7451951
- 23 Westwood Cir SW
- 3 Wilson Dr SW
- 2 Castlewood Dr SW
- 43 Westwood Cir SW
- 6 Greenleaf Dr SW
- 1 Gregory Dr SW
- 0 Cedartown Rd Unit 10479932
- 0 Lexington Ln Unit 7312028
- 0 Lexington Ln Unit 10133164
- 1 Seven Hills Place SW
- 9 Ladonna Place SW
- 1 Chief Vann Dr SW
- 3 Chief Vann Dr SW
- 8 Ridge Dr SW
- 4 Ridge Dr SW
- 9 Ridge Dr SW
- 11 Ridge Dr SW
- 5 Chief Vann Dr SW
- 4 Chief Vann Dr SW
- 0 Ridge Dr SW Unit 8837336
- 0 Ridge Dr SW Unit 8639558
- 0 Ridge Dr SW Unit 8459899
- 0 Ridge Dr SW Unit 8412343
- 0 Ridge Dr SW Unit 8120931
- 0 Ridge Dr SW Unit 8153941
- 0 Ridge Dr SW Unit 8182729
- 0 Ridge Dr SW Unit 7440341
- 0 Ridge Dr SW Unit 7056846
- 0 Ridge Dr SW
- 7 Ridge Dr SW
- 6 Chief Vann Dr SW