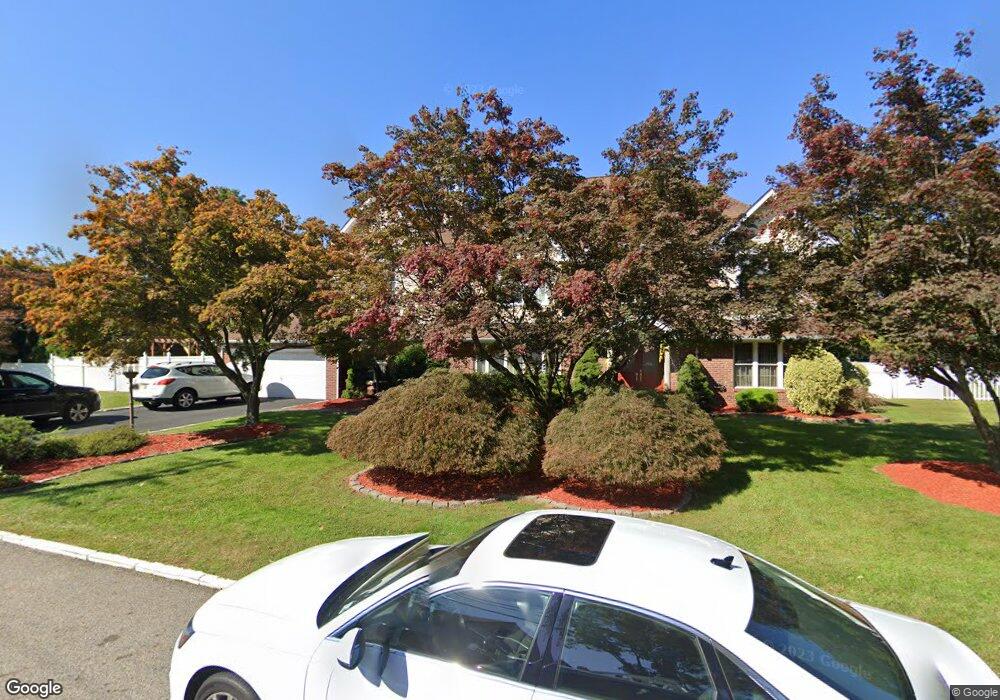
1 Cindy Rd Pine Brook, NJ 07058
Estimated Value: $1,181,698 - $1,316,000
Studio
--
Bath
3,443
Sq Ft
$354/Sq Ft
Est. Value
About This Home
This home is located at 1 Cindy Rd, Pine Brook, NJ 07058 and is currently estimated at $1,220,425, approximately $354 per square foot. 1 Cindy Rd is a home located in Morris County with nearby schools including Montville Township High School, Glenview Academy, and Trinity Christian School.
Ownership History
Date
Name
Owned For
Owner Type
Purchase Details
Closed on
Jul 18, 2011
Sold by
Dasilva Jose A and Dasilva Janaina
Bought by
Majeed Tariq Q
Current Estimated Value
Home Financials for this Owner
Home Financials are based on the most recent Mortgage that was taken out on this home.
Original Mortgage
$539,000
Interest Rate
4.37%
Mortgage Type
Adjustable Rate Mortgage/ARM
Purchase Details
Closed on
Jan 5, 2001
Sold by
Munger Janet Anne and Munger Christopher Thomas
Bought by
Dasilva Jose A and Dasilva Janaina
Home Financials for this Owner
Home Financials are based on the most recent Mortgage that was taken out on this home.
Original Mortgage
$170,000
Interest Rate
7.52%
Mortgage Type
Purchase Money Mortgage
Create a Home Valuation Report for This Property
The Home Valuation Report is an in-depth analysis detailing your home's value as well as a comparison with similar homes in the area
Home Values in the Area
Average Home Value in this Area
Purchase History
| Date | Buyer | Sale Price | Title Company |
|---|---|---|---|
| Majeed Tariq Q | $770,000 | Chicago Title Insurance Co | |
| Dasilva Jose A | $260,000 | Stewart Title Insurance Co |
Source: Public Records
Mortgage History
| Date | Status | Borrower | Loan Amount |
|---|---|---|---|
| Previous Owner | Majeed Tariq Q | $539,000 | |
| Previous Owner | Dasilva Jose A | $170,000 |
Source: Public Records
Tax History
| Year | Tax Paid | Tax Assessment Tax Assessment Total Assessment is a certain percentage of the fair market value that is determined by local assessors to be the total taxable value of land and additions on the property. | Land | Improvement |
|---|---|---|---|---|
| 2025 | $20,774 | $780,700 | $192,900 | $587,800 |
| 2024 | $20,337 | $780,700 | $192,900 | $587,800 |
Source: Public Records
Map
Nearby Homes
- 34 Bloomfield Ave
- 8 John St
- 63 U S 46
- 32 Sylvan Dr
- 171 Old Bloomfield Ave
- 10 Stuart Ct
- 410 Horseneck Rd
- 4 Herbert Place
- 17 Johnson Ave
- 73 Big Piece Rd
- 8 Winfield Ct
- 130 Konner Ave
- 7 Carlson Place
- 11 Laurel Place
- 10 Dorchester Ln
- 18 Eastwood Terrace
- 64 Eastwood Terrace
- 27 Eastwood Terrace
- 79 Eastwood Terrace
- 16 Eastwood Terrace
Your Personal Tour Guide
Ask me questions while you tour the home.