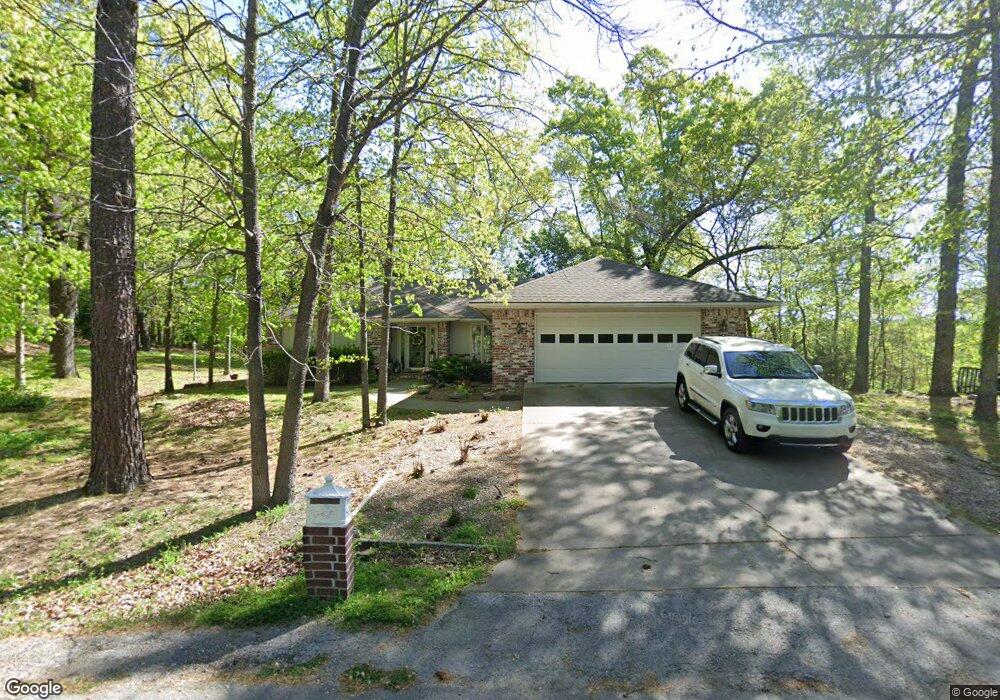
1 Congleton Cir Bella Vista, AR 72714
Estimated Value: $350,000 - $405,000
3
Beds
2
Baths
1,790
Sq Ft
$212/Sq Ft
Est. Value
About This Home
This home is located at 1 Congleton Cir, Bella Vista, AR 72714 and is currently estimated at $379,716, approximately $212 per square foot. 1 Congleton Cir is a home located in Benton County with nearby schools including Cooper Elementary School, Old High Middle School, and Washington Junior High School.
Ownership History
Date
Name
Owned For
Owner Type
Purchase Details
Closed on
Jul 22, 2015
Sold by
Harbick Paul W and Harbick Agnes M
Bought by
Harbick Paul W and Harbick Agnes M
Current Estimated Value
Purchase Details
Closed on
Jul 19, 2006
Sold by
Robertson Robert Donald and Robertson Eunice L
Bought by
Harbick Paul W and Harbick Anges M
Home Financials for this Owner
Home Financials are based on the most recent Mortgage that was taken out on this home.
Original Mortgage
$60,000
Outstanding Balance
$35,452
Interest Rate
6.66%
Estimated Equity
$344,264
Purchase Details
Closed on
Oct 8, 2003
Bought by
Robertson
Purchase Details
Closed on
Aug 21, 1998
Bought by
Dyke
Purchase Details
Closed on
Sep 18, 1996
Bought by
Pauling
Purchase Details
Closed on
Nov 2, 1992
Bought by
Ward
Purchase Details
Closed on
May 22, 1992
Bought by
Bachman
Purchase Details
Closed on
Apr 30, 1982
Bought by
Rice
Create a Home Valuation Report for This Property
The Home Valuation Report is an in-depth analysis detailing your home's value as well as a comparison with similar homes in the area
Home Values in the Area
Average Home Value in this Area
Purchase History
| Date | Buyer | Sale Price | Title Company |
|---|---|---|---|
| Harbick Paul W | -- | Attorney | |
| Harbick Paul W | $173,000 | None Available | |
| Harbick Paul W | $12,000 | None Available | |
| Robertson | $144,000 | -- | |
| Dyke | $135,000 | -- | |
| Pauling | $138,000 | -- | |
| Ward | $92,000 | -- | |
| Bachman | $3,000 | -- | |
| Decd 12 | -- | -- | |
| Rice | -- | -- |
Source: Public Records
Mortgage History
| Date | Status | Borrower | Loan Amount |
|---|---|---|---|
| Open | Harbick Paul W | $60,000 | |
| Closed | Harbick Paul W | $60,000 |
Source: Public Records
Tax History
| Year | Tax Paid | Tax Assessment Tax Assessment Total Assessment is a certain percentage of the fair market value that is determined by local assessors to be the total taxable value of land and additions on the property. | Land | Improvement |
|---|---|---|---|---|
| 2025 | $2,699 | $61,680 | $1,600 | $60,080 |
| 2024 | $2,671 | $61,680 | $1,600 | $60,080 |
| 2023 | $2,429 | $40,160 | $800 | $39,360 |
| 2022 | $2,314 | $40,160 | $800 | $39,360 |
| 2021 | $2,116 | $40,160 | $800 | $39,360 |
| 2020 | $1,941 | $30,470 | $600 | $29,870 |
| 2019 | $1,941 | $30,470 | $600 | $29,870 |
| 2018 | $1,941 | $30,470 | $600 | $29,870 |
| 2017 | $1,868 | $30,470 | $600 | $29,870 |
| 2016 | $1,868 | $30,470 | $600 | $29,870 |
| 2015 | $1,716 | $28,460 | $1,000 | $27,460 |
| 2014 | $1,716 | $28,460 | $1,000 | $27,460 |
Source: Public Records
Map
Nearby Homes
- 12 Manchester Dr
- Lots 37 & 38 Lambeth Dr
- 0 Lambeth Dr
- 0 Congleton Ln
- 3 Parton Ln
- 7 Stratfield Ln
- 0 Hoyer Ln
- Lot 12 & 13 Hoyer Ln
- 31 Dalton Dr
- 11 Westerham Ln
- 3 Donington Ln
- 9 Wantage Ln
- 12 Slifer Ln
- 2 Donington Cir
- 11 Slifer Ln
- 11 Donington Ln
- 13 Coventry Dr
- 0 Donington Ln Unit 1334665
- 0 Donington Ln Unit 1327370
- 4 Winfield Ln
Your Personal Tour Guide
Ask me questions while you tour the home.