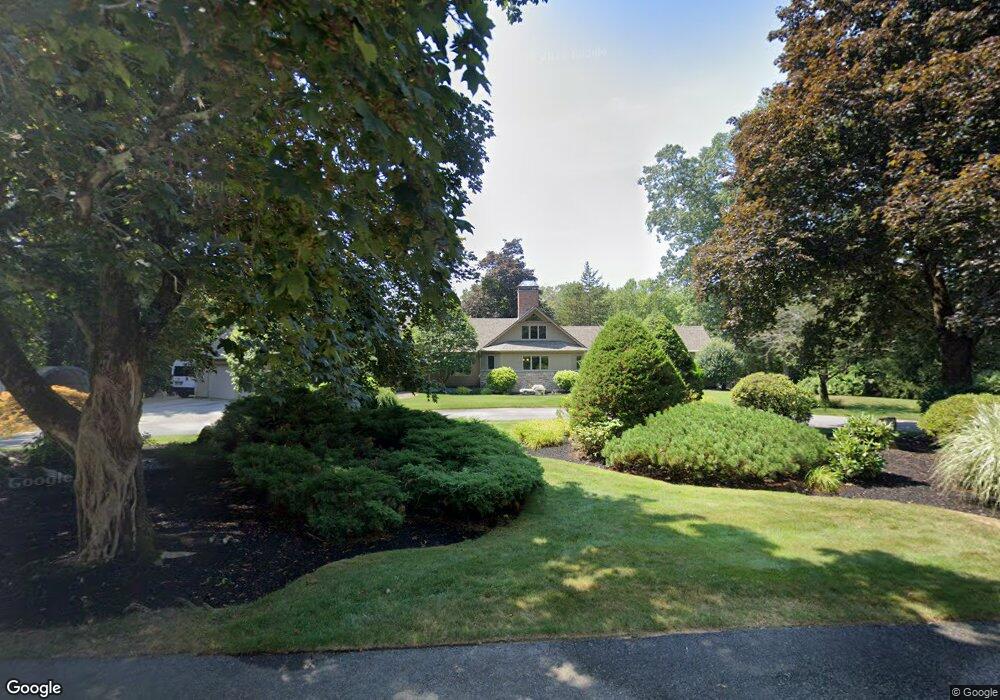
1 Cooks Farm Ln Lynnfield, MA 01940
Estimated Value: $1,392,000 - $1,574,000
3
Beds
4
Baths
2,573
Sq Ft
$585/Sq Ft
Est. Value
About This Home
This home is located at 1 Cooks Farm Ln, Lynnfield, MA 01940 and is currently estimated at $1,504,087, approximately $584 per square foot. 1 Cooks Farm Ln is a home located in Essex County with nearby schools including Lynnfield Middle School, Pickering Middle School, and Lynnfield High School.
Ownership History
Date
Name
Owned For
Owner Type
Purchase Details
Closed on
Nov 1, 2010
Sold by
Supino Michael J and Supino Marianne A
Bought by
1 Cooks Farm Lane Rt and Supino Michael J
Current Estimated Value
Home Financials for this Owner
Home Financials are based on the most recent Mortgage that was taken out on this home.
Original Mortgage
$300,000
Interest Rate
4.36%
Purchase Details
Closed on
Sep 24, 2010
Sold by
1 Cooks Farm Lane Rt and Supino Michael J
Bought by
Supino Michael J and Supino Marianne A
Home Financials for this Owner
Home Financials are based on the most recent Mortgage that was taken out on this home.
Original Mortgage
$300,000
Interest Rate
4.36%
Purchase Details
Closed on
Nov 15, 2002
Sold by
Cooks Farm Lane Rt and Anzuoni Theresa C
Bought by
Supino Michael J and Supino Marianne A
Create a Home Valuation Report for This Property
The Home Valuation Report is an in-depth analysis detailing your home's value as well as a comparison with similar homes in the area
Home Values in the Area
Average Home Value in this Area
Purchase History
| Date | Buyer | Sale Price | Title Company |
|---|---|---|---|
| 1 Cooks Farm Lane Rt | -- | -- | |
| Supino Michael J | -- | -- | |
| Supino Michael J | $150,000 | -- |
Source: Public Records
Mortgage History
| Date | Status | Borrower | Loan Amount |
|---|---|---|---|
| Closed | Supino Michael J | $285,000 | |
| Closed | Supino Michael J | $300,000 | |
| Previous Owner | Supino Michael J | $80,000 |
Source: Public Records
Tax History Compared to Growth
Tax History
| Year | Tax Paid | Tax Assessment Tax Assessment Total Assessment is a certain percentage of the fair market value that is determined by local assessors to be the total taxable value of land and additions on the property. | Land | Improvement |
|---|---|---|---|---|
| 2025 | $15,520 | $1,469,700 | $874,200 | $595,500 |
| 2024 | $14,997 | $1,426,900 | $848,700 | $578,200 |
| 2023 | $14,414 | $1,275,600 | $751,700 | $523,900 |
| 2022 | $13,754 | $1,147,100 | $703,200 | $443,900 |
| 2021 | $11,959 | $901,200 | $485,000 | $416,200 |
| 2020 | $11,533 | $828,500 | $411,300 | $417,200 |
| 2019 | $11,200 | $805,200 | $388,000 | $417,200 |
| 2018 | $11,080 | $805,200 | $388,000 | $417,200 |
| 2017 | $10,409 | $755,400 | $363,800 | $391,600 |
| 2016 | $10,092 | $696,000 | $356,500 | $339,500 |
| 2015 | $9,591 | $661,900 | $355,500 | $306,400 |
Source: Public Records
Map
Nearby Homes
- 16 W Tapley Rd
- 6 Needham Rd
- 7 Hickory Ln
- 15 Park St Unit A
- 15 Park St
- 15 Park St Unit B
- 20 Marshall St
- 8 Cranberry Meadow Way
- 2 Bridle Path
- 12 Cranberry Meadow Way
- 6 Ashley Ct
- 33 Wing Rd
- 20 Pine Hill Rd
- 928 Main St
- 58 Chestnut St
- 19 Fairway Ln
- 19 Fairway Ln Unit 53
- Beverly Plan at Willis Brook at Lynnfield
- Sutton Plan at Willis Brook at Lynnfield
- Topsfield Plan at Willis Brook at Lynnfield
- 3 Cooks Farm Ln
- 607 Chestnut St
- 640 Chestnut St
- 2 Cooks Farm Ln
- 4 Cooks Farm Ln
- 5 Cooks Farm Ln
- 626 Chestnut St
- 650 Chestnut St
- 605 Chestnut St
- 6 Cooks Farm Ln
- 23 Cortland Ln
- 600 Chestnut St
- 661 Chestnut St
- 575 Chestnut St
- 672 Chestnut St
- 21 Cortland Ln
- 602 Chestnut St
- 25 Cortland Ln
- 677 Chestnut St
- 6 Kimberly Terrace