Estimated Value: $2,185,000 - $2,814,000
4
Beds
5
Baths
4,613
Sq Ft
$554/Sq Ft
Est. Value
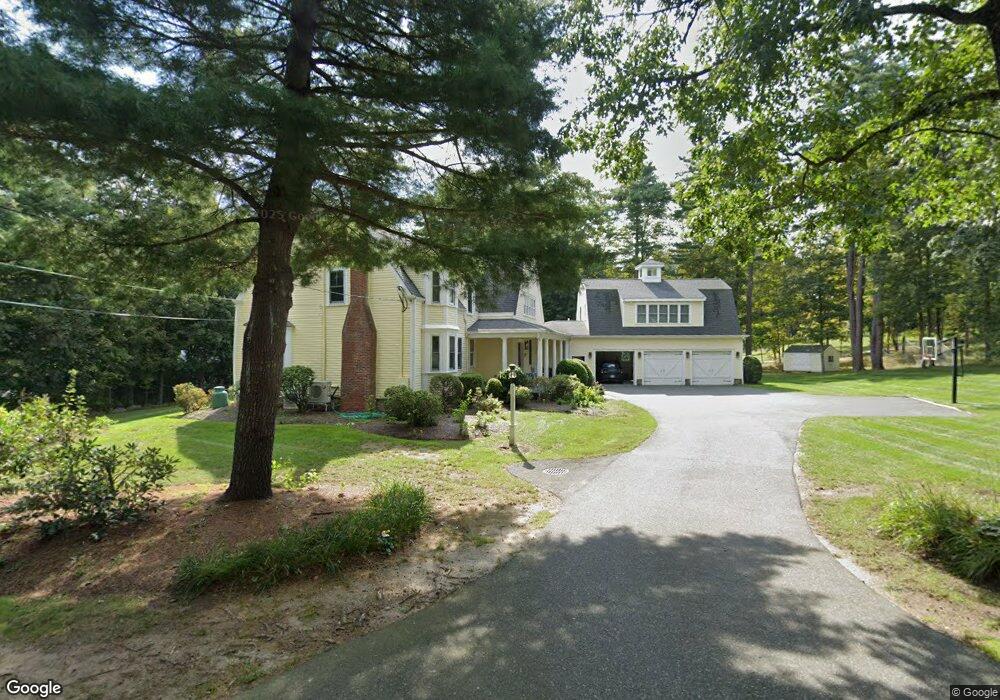
About This Home
This home is located at 1 Cranberry Ln, Dover, MA 02030 and is currently estimated at $2,556,781, approximately $554 per square foot. 1 Cranberry Ln is a home located in Norfolk County with nearby schools including Chickering Elementary School, Dover-Sherborn Regional Middle School, and Dover-Sherborn Regional High School.
Ownership History
Date
Name
Owned For
Owner Type
Purchase Details
Closed on
Mar 17, 2023
Sold by
Sveen Katherine G and Sveen Andrew N
Bought by
Katherine G Sveen Ret
Current Estimated Value
Purchase Details
Closed on
Jun 30, 2005
Sold by
Hurwitz Ann E and Hurwitz Richard
Bought by
Sveen Andrew N and Sveen Katherine G
Home Financials for this Owner
Home Financials are based on the most recent Mortgage that was taken out on this home.
Original Mortgage
$995,000
Interest Rate
5.73%
Mortgage Type
Purchase Money Mortgage
Purchase Details
Closed on
Apr 17, 2003
Sold by
Dobkin Patricia M and Dobkin Steven
Bought by
Hurwitz Ann E and Hurwitz Richard
Purchase Details
Closed on
Sep 1, 1989
Sold by
Pershing Constr
Bought by
Stein Martin M
Create a Home Valuation Report for This Property
The Home Valuation Report is an in-depth analysis detailing your home's value as well as a comparison with similar homes in the area
Home Values in the Area
Average Home Value in this Area
Purchase History
| Date | Buyer | Sale Price | Title Company |
|---|---|---|---|
| Katherine G Sveen Ret | -- | None Available | |
| Sveen Andrew N | $1,496,000 | -- | |
| Hurwitz Ann E | $700,000 | -- | |
| Stein Martin M | $745,000 | -- |
Source: Public Records
Mortgage History
| Date | Status | Borrower | Loan Amount |
|---|---|---|---|
| Previous Owner | Stein Martin M | $399,000 | |
| Previous Owner | Stein Martin M | $417,000 | |
| Previous Owner | Stein Martin M | $220,000 | |
| Previous Owner | Sveen Andrew N | $995,000 | |
| Previous Owner | Stein Martin M | $150,000 |
Source: Public Records
Tax History
| Year | Tax Paid | Tax Assessment Tax Assessment Total Assessment is a certain percentage of the fair market value that is determined by local assessors to be the total taxable value of land and additions on the property. | Land | Improvement |
|---|---|---|---|---|
| 2025 | $27,705 | $2,458,300 | $691,400 | $1,766,900 |
| 2024 | $25,355 | $2,313,400 | $691,400 | $1,622,000 |
| 2023 | $23,616 | $1,937,300 | $547,300 | $1,390,000 |
| 2022 | $21,705 | $1,747,600 | $547,300 | $1,200,300 |
| 2021 | $22,124 | $1,716,400 | $547,300 | $1,169,100 |
| 2020 | $22,039 | $1,716,400 | $547,300 | $1,169,100 |
| 2019 | $22,193 | $1,716,400 | $547,300 | $1,169,100 |
| 2018 | $18,821 | $1,465,800 | $451,500 | $1,014,300 |
| 2017 | $19,374 | $1,484,600 | $438,400 | $1,046,200 |
| 2016 | $19,122 | $1,484,600 | $438,400 | $1,046,200 |
| 2015 | $18,099 | $1,425,100 | $438,400 | $986,700 |
Source: Public Records
Map
Nearby Homes
Your Personal Tour Guide
Ask me questions while you tour the home.