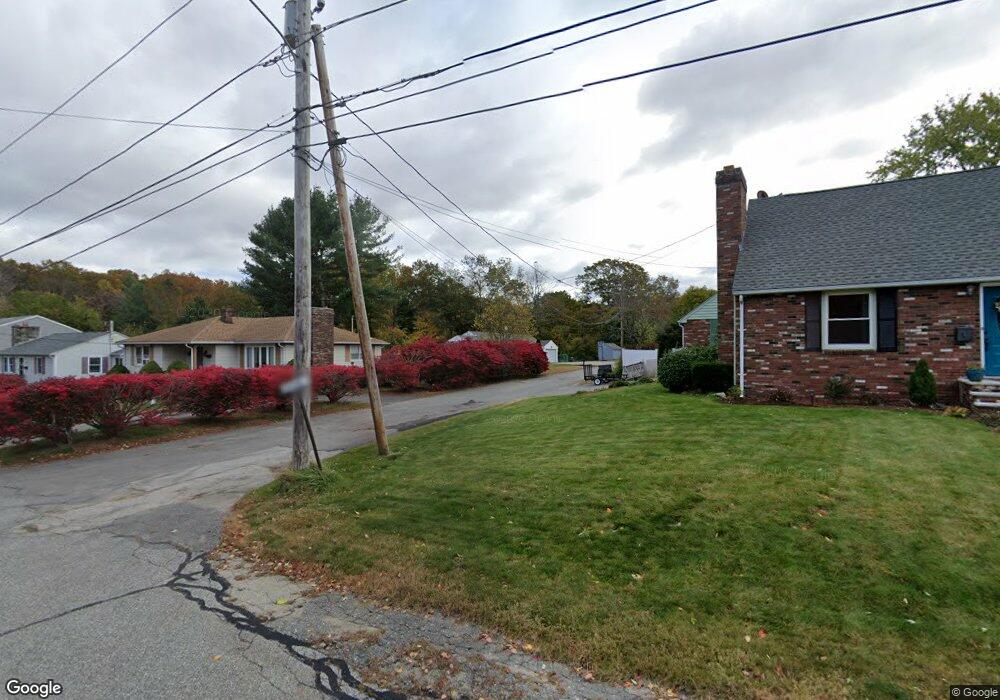
1 Crescent St Oxford, MA 01540
Estimated Value: $386,000 - $489,000
3
Beds
2
Baths
1,820
Sq Ft
$237/Sq Ft
Est. Value
About This Home
This home is located at 1 Crescent St, Oxford, MA 01540 and is currently estimated at $431,168, approximately $236 per square foot. 1 Crescent St is a home located in Worcester County with nearby schools including Alfred M Chaffee, Oxford High School, and Clara Barton Elementary School.
Ownership History
Date
Name
Owned For
Owner Type
Purchase Details
Closed on
Jun 15, 2007
Sold by
Elliott Graeme B and Elliott Wendy M
Bought by
Pittaro Diane T
Current Estimated Value
Purchase Details
Closed on
Dec 12, 1988
Sold by
Nicholson Hugh
Bought by
Carey John T
Create a Home Valuation Report for This Property
The Home Valuation Report is an in-depth analysis detailing your home's value as well as a comparison with similar homes in the area
Home Values in the Area
Average Home Value in this Area
Purchase History
| Date | Buyer | Sale Price | Title Company |
|---|---|---|---|
| Pittaro Diane T | $255,000 | -- | |
| Pittaro Diane T | $255,000 | -- | |
| Carey John T | $128,500 | -- |
Source: Public Records
Mortgage History
| Date | Status | Borrower | Loan Amount |
|---|---|---|---|
| Previous Owner | Carey John T | $60,050 | |
| Previous Owner | Carey John T | $100,000 | |
| Previous Owner | Carey John T | $102,300 | |
| Closed | Carey John T | $0 |
Source: Public Records
Tax History Compared to Growth
Tax History
| Year | Tax Paid | Tax Assessment Tax Assessment Total Assessment is a certain percentage of the fair market value that is determined by local assessors to be the total taxable value of land and additions on the property. | Land | Improvement |
|---|---|---|---|---|
| 2025 | $48 | $381,200 | $93,000 | $288,200 |
| 2024 | $4,572 | $339,200 | $86,200 | $253,000 |
| 2023 | $4,550 | $333,600 | $77,000 | $256,600 |
| 2022 | $4,169 | $258,000 | $66,700 | $191,300 |
| 2021 | $3,880 | $234,700 | $63,300 | $171,400 |
| 2020 | $3,745 | $224,800 | $63,300 | $161,500 |
| 2019 | $3,421 | $200,900 | $63,200 | $137,700 |
| 2018 | $3,204 | $185,500 | $63,200 | $122,300 |
| 2017 | $3,205 | $190,200 | $63,200 | $127,000 |
| 2016 | $3,220 | $190,200 | $63,200 | $127,000 |
| 2015 | $3,003 | $190,200 | $63,200 | $127,000 |
| 2014 | $2,943 | $196,200 | $63,200 | $133,000 |
Source: Public Records
Map
Nearby Homes