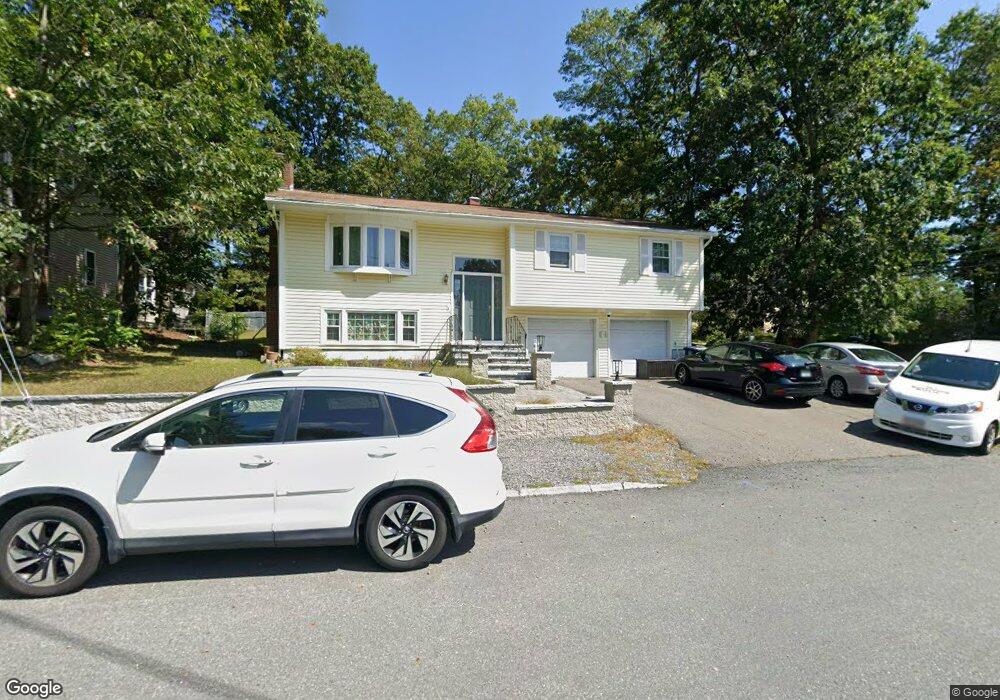
1 Doncaster Dr Nashua, NH 03062
Southwest Nashua NeighborhoodEstimated Value: $517,646 - $605,000
3
Beds
2
Baths
1,190
Sq Ft
$461/Sq Ft
Est. Value
About This Home
This home is located at 1 Doncaster Dr, Nashua, NH 03062 and is currently estimated at $549,162, approximately $461 per square foot. 1 Doncaster Dr is a home located in Hillsborough County with nearby schools including New Searles School, Fairgrounds Middle School, and Nashua High School South.
Ownership History
Date
Name
Owned For
Owner Type
Purchase Details
Closed on
Jan 14, 2021
Sold by
Chou Ft and Chou
Bought by
Filho-Onofre Miranda and Andrade Gerusa
Current Estimated Value
Purchase Details
Closed on
Apr 16, 2020
Sold by
Chou Li-Chuan
Bought by
Chou Ft and Chou
Purchase Details
Closed on
Jan 16, 1979
Bought by
Chou Hal and Chaun Li
Create a Home Valuation Report for This Property
The Home Valuation Report is an in-depth analysis detailing your home's value as well as a comparison with similar homes in the area
Home Values in the Area
Average Home Value in this Area
Purchase History
| Date | Buyer | Sale Price | Title Company |
|---|---|---|---|
| Filho-Onofre Miranda | $320,000 | None Available | |
| Chou Ft | -- | None Available | |
| Chou Hal | -- | -- |
Source: Public Records
Mortgage History
| Date | Status | Borrower | Loan Amount |
|---|---|---|---|
| Previous Owner | Chou Hal | $57,500 |
Source: Public Records
Tax History Compared to Growth
Tax History
| Year | Tax Paid | Tax Assessment Tax Assessment Total Assessment is a certain percentage of the fair market value that is determined by local assessors to be the total taxable value of land and additions on the property. | Land | Improvement |
|---|---|---|---|---|
| 2024 | $7,675 | $482,700 | $167,500 | $315,200 |
| 2023 | $7,297 | $400,300 | $134,000 | $266,300 |
| 2022 | $7,233 | $400,300 | $134,000 | $266,300 |
| 2021 | $6,346 | $273,300 | $89,300 | $184,000 |
| 2020 | $6,179 | $273,300 | $89,300 | $184,000 |
| 2019 | $5,947 | $273,300 | $89,300 | $184,000 |
| 2018 | $5,797 | $273,300 | $89,300 | $184,000 |
| 2017 | $5,718 | $221,700 | $69,300 | $152,400 |
| 2016 | $5,558 | $221,700 | $69,300 | $152,400 |
| 2015 | $5,438 | $221,700 | $69,300 | $152,400 |
| 2014 | $5,332 | $221,700 | $69,300 | $152,400 |
Source: Public Records
Map
Nearby Homes