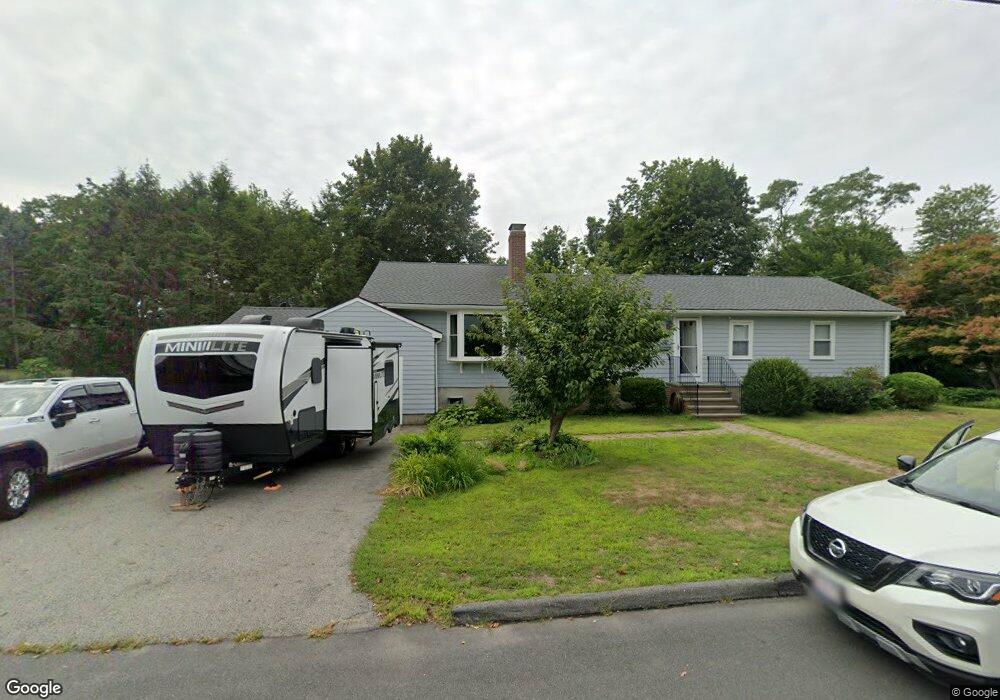
1 Donegal Ln Danvers, MA 01923
Estimated Value: $756,998 - $1,268,000
4
Beds
3
Baths
2,852
Sq Ft
$341/Sq Ft
Est. Value
About This Home
This home is located at 1 Donegal Ln, Danvers, MA 01923 and is currently estimated at $972,250, approximately $340 per square foot. 1 Donegal Ln is a home located in Essex County with nearby schools including Danvers High School, St. Mary of the Annunciation School, and St. John's Prep.
Ownership History
Date
Name
Owned For
Owner Type
Purchase Details
Closed on
Nov 14, 2023
Sold by
Benson David J and Benson Maureen E
Bought by
Benson T T and Benson B
Current Estimated Value
Purchase Details
Closed on
Mar 31, 1998
Sold by
Fleet Jeffrey D and Fleet Stephanie A
Bought by
Benson David J and Benson Maureen E
Purchase Details
Closed on
Oct 27, 1992
Sold by
Maloy Steven R and Maloy Deborah
Bought by
Fleet Jeffrey and Fleet Stephanie
Create a Home Valuation Report for This Property
The Home Valuation Report is an in-depth analysis detailing your home's value as well as a comparison with similar homes in the area
Home Values in the Area
Average Home Value in this Area
Purchase History
| Date | Buyer | Sale Price | Title Company |
|---|---|---|---|
| Benson T T | -- | None Available | |
| Benson David J | $227,000 | -- | |
| Fleet Jeffrey | $179,500 | -- |
Source: Public Records
Mortgage History
| Date | Status | Borrower | Loan Amount |
|---|---|---|---|
| Previous Owner | Fleet Jeffrey | $180,000 | |
| Previous Owner | Fleet Jeffrey | $135,000 |
Source: Public Records
Tax History
| Year | Tax Paid | Tax Assessment Tax Assessment Total Assessment is a certain percentage of the fair market value that is determined by local assessors to be the total taxable value of land and additions on the property. | Land | Improvement |
|---|---|---|---|---|
| 2025 | $7,353 | $669,100 | $385,500 | $283,600 |
| 2024 | $7,394 | $665,500 | $385,500 | $280,000 |
| 2023 | $7,068 | $601,500 | $350,400 | $251,100 |
| 2022 | $6,898 | $544,900 | $318,000 | $226,900 |
| 2021 | $6,544 | $490,200 | $301,200 | $189,000 |
| 2020 | $6,301 | $482,500 | $297,700 | $184,800 |
| 2019 | $6,049 | $455,500 | $270,700 | $184,800 |
| 2018 | $5,836 | $431,000 | $268,000 | $163,000 |
| 2017 | $5,602 | $394,800 | $234,300 | $160,500 |
| 2016 | $5,237 | $368,800 | $223,500 | $145,300 |
| 2015 | $4,956 | $332,400 | $203,200 | $129,200 |
Source: Public Records
Map
Nearby Homes
Your Personal Tour Guide
Ask me questions while you tour the home.