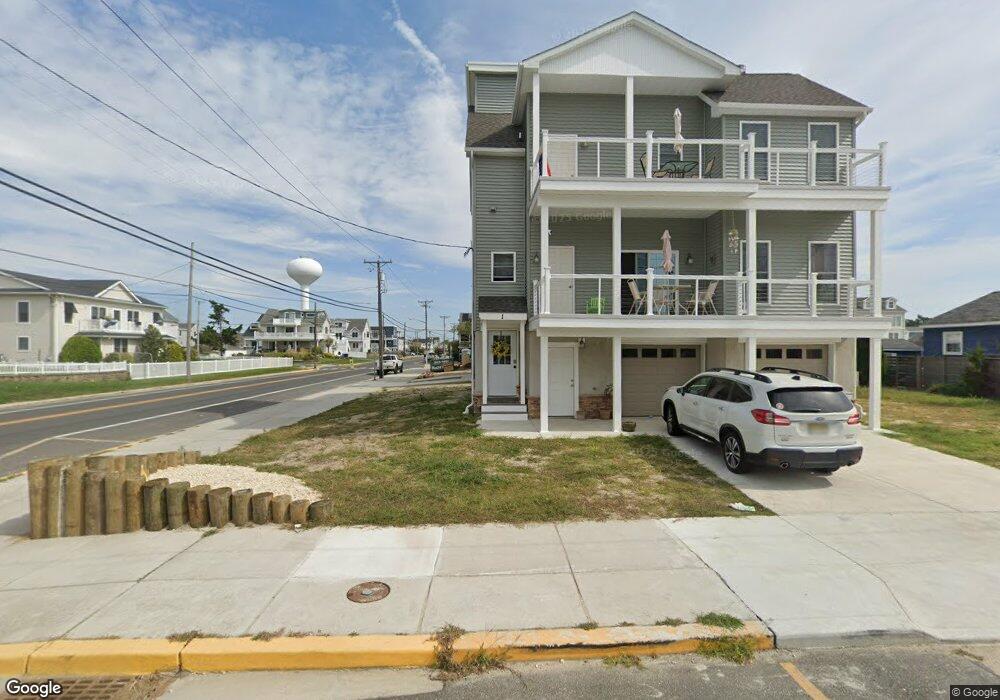
1 E Sherman Ave Strathmere, NJ 08248
Estimated Value: $1,993,000 - $2,356,000
4
Beds
5
Baths
2,975
Sq Ft
$731/Sq Ft
Est. Value
About This Home
This home is located at 1 E Sherman Ave, Strathmere, NJ 08248 and is currently estimated at $2,175,337, approximately $731 per square foot. 1 E Sherman Ave is a home located in Cape May County with nearby schools including Ocean City Primary School, Ocean City Intermediate School, and Ocean City High School.
Ownership History
Date
Name
Owned For
Owner Type
Purchase Details
Closed on
Jul 10, 2025
Sold by
Vanover Jason Lee and Vanover Brittany
Bought by
Renata Holdings Llc
Current Estimated Value
Home Financials for this Owner
Home Financials are based on the most recent Mortgage that was taken out on this home.
Original Mortgage
$1,200,000
Outstanding Balance
$1,197,964
Interest Rate
6.84%
Mortgage Type
New Conventional
Estimated Equity
$977,373
Purchase Details
Closed on
Jul 31, 2023
Sold by
Deger William and Deger Heidi
Bought by
Vanover Jason Lee and Vanover Brittany
Home Financials for this Owner
Home Financials are based on the most recent Mortgage that was taken out on this home.
Original Mortgage
$1,500,000
Interest Rate
7.63%
Mortgage Type
Construction
Purchase Details
Closed on
Jul 31, 2018
Sold by
Nolan Robert A
Bought by
Prudential Bank
Purchase Details
Closed on
Mar 3, 2008
Purchase Details
Closed on
Jul 15, 2003
Sold by
Schiavo Rita
Bought by
James Bonner Family Partnershi
Create a Home Valuation Report for This Property
The Home Valuation Report is an in-depth analysis detailing your home's value as well as a comparison with similar homes in the area
Home Values in the Area
Average Home Value in this Area
Purchase History
| Date | Buyer | Sale Price | Title Company |
|---|---|---|---|
| Renata Holdings Llc | $1,900,000 | First American Title Insurance | |
| Renata Holdings Llc | $1,900,000 | First American Title Insurance | |
| Vanover Jason Lee | $2,000,000 | Absecon Title | |
| Vanover Jason Lee | $2,000,000 | Absecon Title | |
| Prudential Bank | -- | -- | |
| -- | -- | -- | |
| James Bonner Family Partnershi | $275,000 | -- |
Source: Public Records
Mortgage History
| Date | Status | Borrower | Loan Amount |
|---|---|---|---|
| Open | Renata Holdings Llc | $1,200,000 | |
| Previous Owner | Vanover Jason Lee | $1,500,000 |
Source: Public Records
Tax History
| Year | Tax Paid | Tax Assessment Tax Assessment Total Assessment is a certain percentage of the fair market value that is determined by local assessors to be the total taxable value of land and additions on the property. | Land | Improvement |
|---|---|---|---|---|
| 2025 | $22,477 | $1,012,000 | $440,000 | $572,000 |
| 2024 | $22,477 | $1,012,000 | $440,000 | $572,000 |
| 2023 | $21,343 | $1,012,000 | $440,000 | $572,000 |
| 2022 | $20,625 | $1,012,000 | $440,000 | $572,000 |
| 2021 | $19,866 | $1,012,000 | $440,000 | $572,000 |
| 2020 | $19,117 | $1,012,000 | $440,000 | $572,000 |
| 2019 | $18,651 | $1,012,000 | $440,000 | $572,000 |
| 2018 | $18,165 | $1,012,000 | $440,000 | $572,000 |
| 2017 | $17,963 | $1,012,000 | $440,000 | $572,000 |
| 2016 | $18,236 | $1,012,000 | $440,000 | $572,000 |
| 2015 | $17,750 | $1,012,000 | $440,000 | $572,000 |
| 2014 | $15,763 | $1,100,000 | $446,900 | $653,100 |
Source: Public Records
Map
Nearby Homes
- 5 E Sumner Ave
- 18 E Randolph Ave
- 104 Prescott Ave
- 901 S Commonwealth Ave Unit SOUTH UNIT
- 901 S Commonwealth Ave Unit South
- 10 E Winthrop Ave
- 22 Williams Ave
- 18 E Winthrop Ave
- 117 Taylor Ave
- 118 2nd St Unit East
- 5732 Central 1st Ave Unit 1st
- 5734 Central Ave Unit 5734
- 5647 Asbury Ave Unit 2nd Floor
- 1731 Route 9 Unit 11
- 1731 Route 9 Unit 28
- 1731 Route 9 Unit 25
- 5516 Asbury Ave Unit 18
- 5512 Asbury Ave
- 400 E 55th St Unit E
- 400 E 55th St Unit D
- 1 W Sherman Ave
- 5 W Sherman Ave
- 2 W Sumner Ave
- 513 S Bayview Dr
- 507 S Bayview Dr Unit North
- 507-509 S Bayview Ave Unit South
- 4 W Sherman Ave
- 6 W Sumner Ave
- 100 W Sherman Ave
- 505 S Bayview Dr
- 104 W Sherman Ave
- 2 E Sherman Ave
- 10 W Sumner Ave
- 501 S Bayview Dr
- 5 E Sherman Ave
- 1 W Randolph Ave
- 6 E Sumner Ave
- 512 S Bayview Dr
- 14 E Sherman Ave
- 9 E Sherman Ave
Your Personal Tour Guide
Ask me questions while you tour the home.