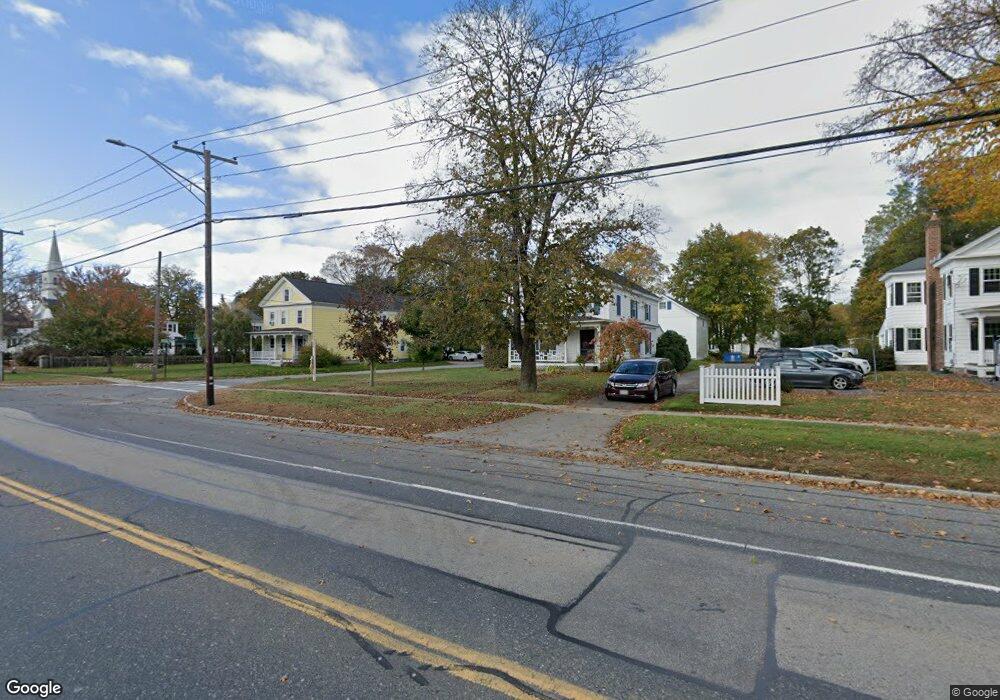
1 Elm St Oxford, MA 01540
Estimated Value: $323,400 - $449,000
2
Beds
2
Baths
1,144
Sq Ft
$346/Sq Ft
Est. Value
About This Home
This home is located at 1 Elm St, Oxford, MA 01540 and is currently estimated at $396,100, approximately $346 per square foot. 1 Elm St is a home located in Worcester County with nearby schools including Alfred M Chaffee, Oxford High School, and Clara Barton Elementary School.
Ownership History
Date
Name
Owned For
Owner Type
Purchase Details
Closed on
Oct 22, 2021
Sold by
Sneade Dylan J
Bought by
Sneade Dennis R
Current Estimated Value
Home Financials for this Owner
Home Financials are based on the most recent Mortgage that was taken out on this home.
Original Mortgage
$212,657
Outstanding Balance
$193,923
Interest Rate
2.8%
Mortgage Type
FHA
Estimated Equity
$202,177
Purchase Details
Closed on
Oct 16, 2020
Sold by
Sneade Derek
Bought by
Sneade Dylan J
Home Financials for this Owner
Home Financials are based on the most recent Mortgage that was taken out on this home.
Original Mortgage
$120,000
Interest Rate
2.9%
Mortgage Type
New Conventional
Purchase Details
Closed on
Jan 21, 2009
Sold by
Balcunas Linda M
Bought by
Sneade Derek
Home Financials for this Owner
Home Financials are based on the most recent Mortgage that was taken out on this home.
Original Mortgage
$142,450
Interest Rate
5.51%
Mortgage Type
Purchase Money Mortgage
Create a Home Valuation Report for This Property
The Home Valuation Report is an in-depth analysis detailing your home's value as well as a comparison with similar homes in the area
Home Values in the Area
Average Home Value in this Area
Purchase History
| Date | Buyer | Sale Price | Title Company |
|---|---|---|---|
| Sneade Dennis R | $220,000 | None Available | |
| Sneade Dylan J | $150,000 | None Available | |
| Sneade Derek | $150,000 | -- |
Source: Public Records
Mortgage History
| Date | Status | Borrower | Loan Amount |
|---|---|---|---|
| Open | Sneade Dennis R | $212,657 | |
| Previous Owner | Sneade Dylan J | $120,000 | |
| Previous Owner | Sneade Derek | $142,450 |
Source: Public Records
Tax History Compared to Growth
Tax History
| Year | Tax Paid | Tax Assessment Tax Assessment Total Assessment is a certain percentage of the fair market value that is determined by local assessors to be the total taxable value of land and additions on the property. | Land | Improvement |
|---|---|---|---|---|
| 2025 | $35 | $272,600 | $81,800 | $190,800 |
| 2024 | $3,157 | $234,200 | $72,900 | $161,300 |
| 2023 | $3,372 | $247,200 | $65,100 | $182,100 |
| 2022 | $3,471 | $214,800 | $61,400 | $153,400 |
| 2021 | $3,248 | $196,500 | $58,400 | $138,100 |
| 2020 | $3,027 | $181,700 | $58,400 | $123,300 |
| 2019 | $2,934 | $172,300 | $58,400 | $113,900 |
| 2018 | $2,976 | $172,300 | $58,400 | $113,900 |
| 2017 | $2,982 | $177,000 | $58,400 | $118,600 |
| 2016 | $2,997 | $177,000 | $58,400 | $118,600 |
| 2015 | $2,795 | $177,000 | $58,400 | $118,600 |
| 2014 | $2,751 | $183,400 | $58,400 | $125,000 |
Source: Public Records
Map
Nearby Homes