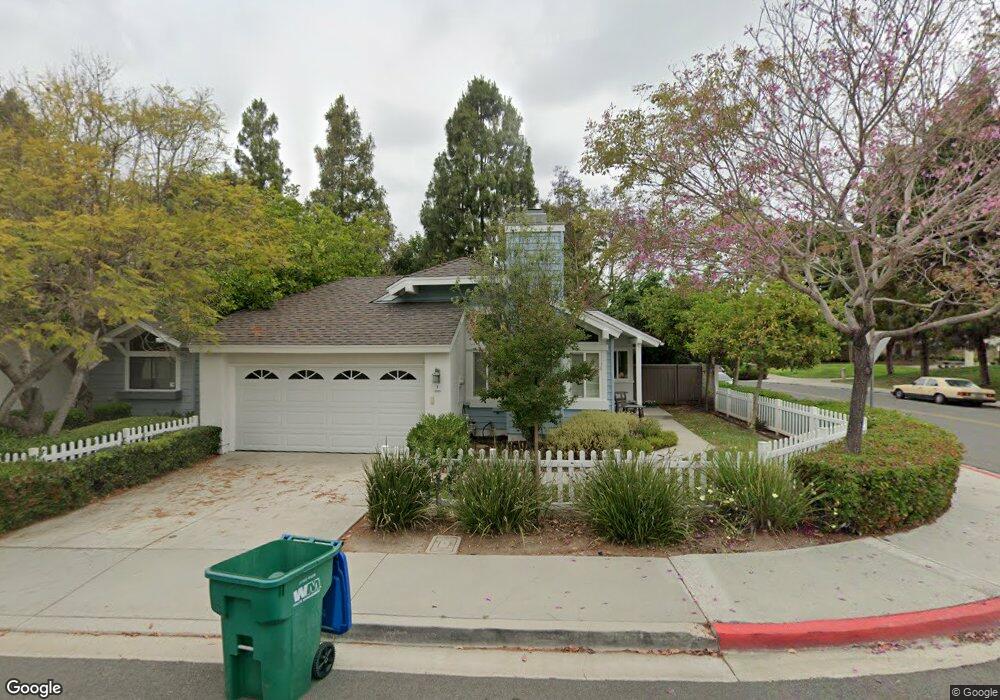
1 Fallcrest Unit 98 Irvine, CA 92614
Woodbridge NeighborhoodEstimated Value: $918,000 - $1,047,000
3
Beds
2
Baths
1,144
Sq Ft
$856/Sq Ft
Est. Value
About This Home
This home is located at 1 Fallcrest Unit 98, Irvine, CA 92614 and is currently estimated at $978,959, approximately $855 per square foot. 1 Fallcrest Unit 98 is a home located in Orange County with nearby schools including Springbrook Elementary School, South Lake Middle School, and Woodbridge High School.
Ownership History
Date
Name
Owned For
Owner Type
Purchase Details
Closed on
Dec 1, 2009
Sold by
Polaris Solutions Llc
Bought by
Adelman Olivia and Adelman Martin
Current Estimated Value
Purchase Details
Closed on
Nov 19, 2009
Sold by
Marks Matt J
Bought by
Polaris Solutions Llc and 1 Fallcrest Trust
Purchase Details
Closed on
Dec 7, 2006
Sold by
Wang Gim and Wang Mei Yin
Bought by
Marks Matt J
Home Financials for this Owner
Home Financials are based on the most recent Mortgage that was taken out on this home.
Original Mortgage
$452,000
Interest Rate
8.87%
Mortgage Type
Negative Amortization
Purchase Details
Closed on
Jun 21, 2004
Sold by
Wang Gim
Bought by
Wang Gim and Wang Mei Yin
Purchase Details
Closed on
Dec 29, 1998
Sold by
Gim Wang
Bought by
Wang Gim and The Gim Wang Living Trust
Purchase Details
Closed on
Dec 8, 1998
Sold by
Yin Wang Mei
Bought by
Wang Gim
Create a Home Valuation Report for This Property
The Home Valuation Report is an in-depth analysis detailing your home's value as well as a comparison with similar homes in the area
Home Values in the Area
Average Home Value in this Area
Purchase History
| Date | Buyer | Sale Price | Title Company |
|---|---|---|---|
| Adelman Olivia | $470,000 | Landamerica Lawyers Title Co | |
| Polaris Solutions Llc | -- | Accommodation | |
| Marks Matt J | $565,000 | Fidelity National Title | |
| Wang Gim | -- | -- | |
| Wang Gim | -- | -- | |
| Wang Gim | -- | -- |
Source: Public Records
Mortgage History
| Date | Status | Borrower | Loan Amount |
|---|---|---|---|
| Previous Owner | Marks Matt J | $452,000 |
Source: Public Records
Tax History
| Year | Tax Paid | Tax Assessment Tax Assessment Total Assessment is a certain percentage of the fair market value that is determined by local assessors to be the total taxable value of land and additions on the property. | Land | Improvement |
|---|---|---|---|---|
| 2025 | $6,470 | $606,680 | $472,075 | $134,605 |
| 2024 | $6,470 | $594,785 | $462,819 | $131,966 |
| 2023 | $6,304 | $583,123 | $453,744 | $129,379 |
| 2022 | $6,183 | $571,690 | $444,847 | $126,843 |
| 2021 | $6,041 | $560,481 | $436,125 | $124,356 |
| 2020 | $6,007 | $554,734 | $431,653 | $123,081 |
| 2019 | $5,875 | $543,857 | $423,189 | $120,668 |
| 2018 | $5,771 | $533,194 | $414,892 | $118,302 |
| 2017 | $5,653 | $522,740 | $406,757 | $115,983 |
| 2016 | $5,406 | $512,491 | $398,782 | $113,709 |
| 2015 | $5,326 | $504,793 | $392,792 | $112,001 |
| 2014 | $5,223 | $494,905 | $385,097 | $109,808 |
Source: Public Records
Map
Nearby Homes
- 1 Fallcrest
- 3 Fallcrest
- 5 Fallcrest Unit 96
- 6 Fallcrest Unit 101
- 60 Amberleaf
- 51 Amberleaf Unit 118
- 51 Amberleaf
- 49 Amberleaf Unit 117
- 4 Fallcrest Unit 100
- 50 Amberleaf Unit 90
- 50 Amberleaf
- 58 Amberleaf
- 40 Winterhaven Unit 102
- 40 Winterhaven
- 2 Fallcrest Unit 99
- 52 Amberleaf Unit 91
- 52 Amberleaf
- 42 Winterhaven Unit 103
- 56 Amberleaf Unit 93
- 56 Amberleaf
Your Personal Tour Guide
Ask me questions while you tour the home.