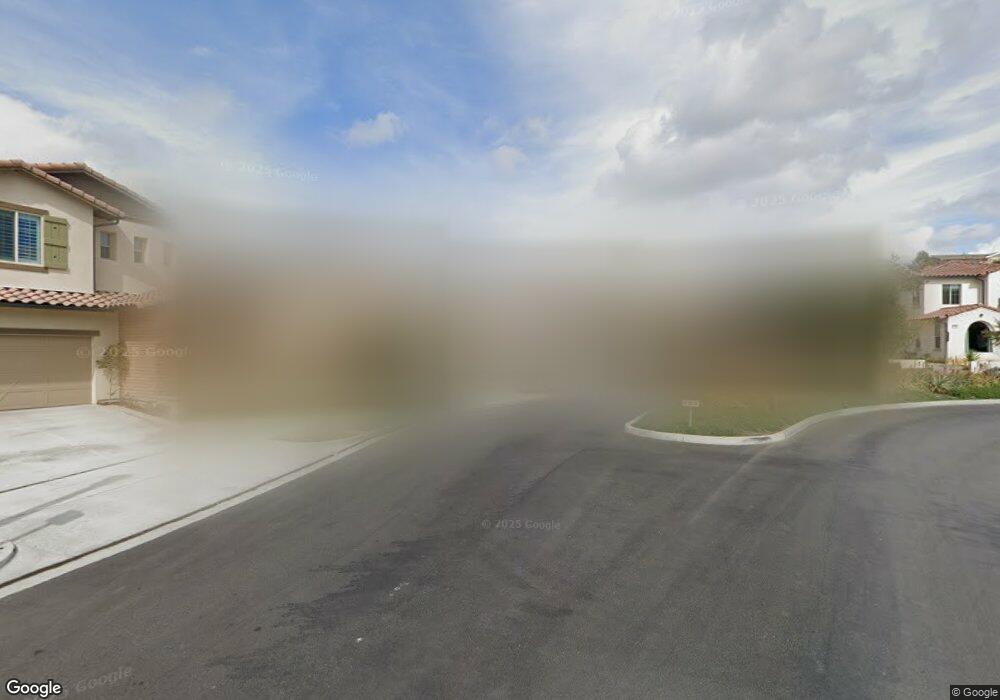
1 Farra St Rancho Mission Viejo, CA 92694
Estimated Value: $1,751,000 - $1,995,000
3
Beds
3
Baths
2,695
Sq Ft
$686/Sq Ft
Est. Value
About This Home
This home is located at 1 Farra St, Rancho Mission Viejo, CA 92694 and is currently estimated at $1,848,448, approximately $685 per square foot. 1 Farra St is a home with nearby schools including Esencia, Tesoro High School, and Montessori of Ladera Ranch School.
Ownership History
Date
Name
Owned For
Owner Type
Purchase Details
Closed on
Feb 23, 2020
Sold by
Sjulin Brandon Scott and Sjulin Tiffany Ann
Bought by
Sjulin Brandon and Sjulin Tiffany
Current Estimated Value
Home Financials for this Owner
Home Financials are based on the most recent Mortgage that was taken out on this home.
Original Mortgage
$770,000
Interest Rate
3.55%
Mortgage Type
New Conventional
Purchase Details
Closed on
Sep 8, 2014
Sold by
Ryland Homes Of California Inc
Bought by
Sjulin Brandon Scott and Sjulin Tiffany Ann
Home Financials for this Owner
Home Financials are based on the most recent Mortgage that was taken out on this home.
Original Mortgage
$768,437
Interest Rate
4.2%
Mortgage Type
New Conventional
Create a Home Valuation Report for This Property
The Home Valuation Report is an in-depth analysis detailing your home's value as well as a comparison with similar homes in the area
Home Values in the Area
Average Home Value in this Area
Purchase History
| Date | Buyer | Sale Price | Title Company |
|---|---|---|---|
| Sjulin Brandon | -- | Wfg National Title | |
| Sjulin Brandon Scott | $961,000 | First American Title Company |
Source: Public Records
Mortgage History
| Date | Status | Borrower | Loan Amount |
|---|---|---|---|
| Previous Owner | Sjulin Brandon | $770,000 | |
| Previous Owner | Sjulin Brandon Scott | $768,437 |
Source: Public Records
Tax History
| Year | Tax Paid | Tax Assessment Tax Assessment Total Assessment is a certain percentage of the fair market value that is determined by local assessors to be the total taxable value of land and additions on the property. | Land | Improvement |
|---|---|---|---|---|
| 2025 | $14,960 | $1,154,425 | $599,245 | $555,180 |
| 2024 | $14,960 | $1,131,790 | $587,495 | $544,295 |
| 2023 | $14,625 | $1,109,599 | $575,976 | $533,623 |
| 2022 | $15,652 | $1,087,843 | $564,683 | $523,160 |
| 2021 | $15,409 | $1,066,513 | $553,611 | $512,902 |
| 2020 | $15,278 | $1,055,578 | $547,935 | $507,643 |
| 2019 | $15,237 | $1,034,881 | $537,191 | $497,690 |
| 2018 | $15,090 | $1,014,590 | $526,658 | $487,932 |
| 2017 | $15,168 | $994,697 | $516,332 | $478,365 |
| 2016 | $15,297 | $975,194 | $506,208 | $468,986 |
| 2015 | $14,882 | $960,546 | $498,604 | $461,942 |
| 2014 | $8,578 | $335,158 | $335,158 | $0 |
Source: Public Records
Map
Nearby Homes
Your Personal Tour Guide
Ask me questions while you tour the home.