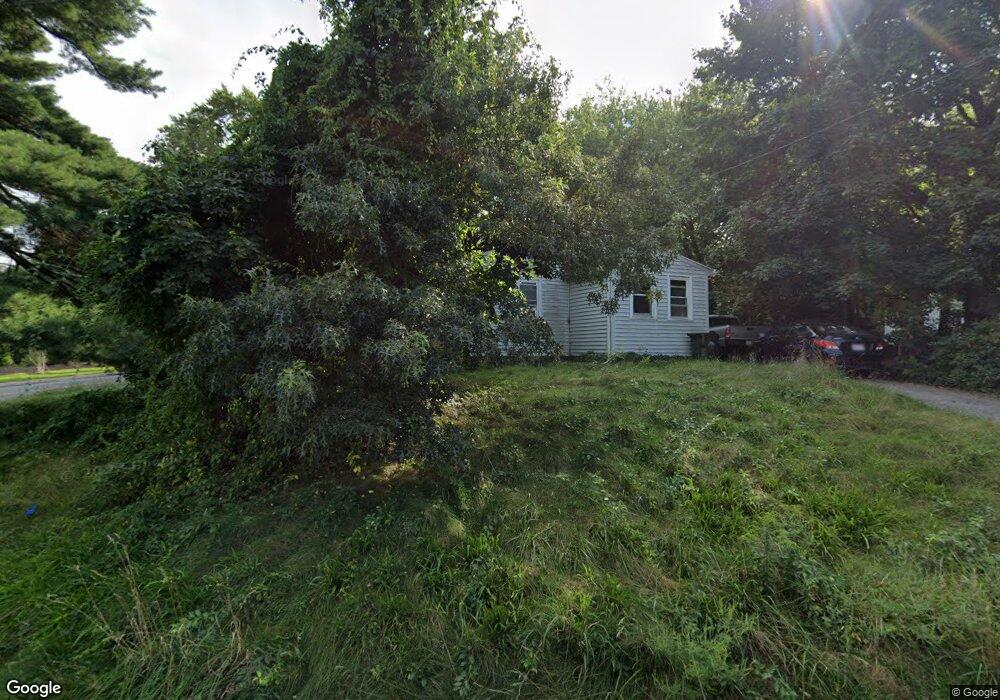
1 Glenbrook Ave Bellingham, MA 02019
Estimated Value: $414,562 - $451,000
3
Beds
1
Bath
960
Sq Ft
$450/Sq Ft
Est. Value
About This Home
This home is located at 1 Glenbrook Ave, Bellingham, MA 02019 and is currently estimated at $432,141, approximately $450 per square foot. 1 Glenbrook Ave is a home located in Norfolk County with nearby schools including Joseph F. DiPietro Elementary, Bellingham High School, and Bethany Christian Academy.
Ownership History
Date
Name
Owned For
Owner Type
Purchase Details
Closed on
Dec 30, 1992
Sold by
Cresley Theodore P and Cresley Carole A
Bought by
Godfroy Leonard F and Godfroy Debra A
Current Estimated Value
Home Financials for this Owner
Home Financials are based on the most recent Mortgage that was taken out on this home.
Original Mortgage
$60,000
Interest Rate
8.32%
Mortgage Type
Purchase Money Mortgage
Create a Home Valuation Report for This Property
The Home Valuation Report is an in-depth analysis detailing your home's value as well as a comparison with similar homes in the area
Home Values in the Area
Average Home Value in this Area
Purchase History
| Date | Buyer | Sale Price | Title Company |
|---|---|---|---|
| Godfroy Leonard F | $95,000 | -- | |
| Godfroy Leonard F | $95,000 | -- |
Source: Public Records
Mortgage History
| Date | Status | Borrower | Loan Amount |
|---|---|---|---|
| Closed | Godfroy Leonard F | $60,000 |
Source: Public Records
Tax History Compared to Growth
Tax History
| Year | Tax Paid | Tax Assessment Tax Assessment Total Assessment is a certain percentage of the fair market value that is determined by local assessors to be the total taxable value of land and additions on the property. | Land | Improvement |
|---|---|---|---|---|
| 2025 | $4,348 | $346,200 | $165,000 | $181,200 |
| 2024 | $4,159 | $323,400 | $150,700 | $172,700 |
| 2023 | $4,009 | $307,200 | $143,500 | $163,700 |
| 2022 | $3,880 | $275,600 | $119,600 | $156,000 |
| 2021 | $3,777 | $262,100 | $119,600 | $142,500 |
| 2020 | $3,522 | $247,700 | $119,600 | $128,100 |
| 2019 | $3,449 | $242,700 | $119,600 | $123,100 |
| 2018 | $3,172 | $220,100 | $115,000 | $105,100 |
| 2017 | $3,107 | $216,700 | $115,000 | $101,700 |
| 2016 | $2,957 | $206,900 | $113,100 | $93,800 |
| 2015 | $2,836 | $199,000 | $108,800 | $90,200 |
| 2014 | $2,841 | $193,800 | $106,300 | $87,500 |
Source: Public Records
Map
Nearby Homes
- 975 S Main St
- 0 North St Unit 73440626
- 46 Douglas Dr
- 26 Iris Ln
- 11 Silver Ave
- 19 Geordan Ave
- 1 Clover Dr
- 211 S Main St
- 17 Susan Ln
- 125 Blackstone St
- 89 Lakeview Ave
- 1099 S Main St
- 36 Indian Run Rd
- 7 Debra Ln
- 1136 S Main St
- 501 Old Bridge Ln Unit 501
- 352 Lake St
- 1303 Old Bridge Ln Unit 1303
- 1501 Old Bridge Ln Unit 1501
- 0 Prospect St