Estimated Value: $556,000 - $659,000
--
Bed
3
Baths
2,978
Sq Ft
$202/Sq Ft
Est. Value
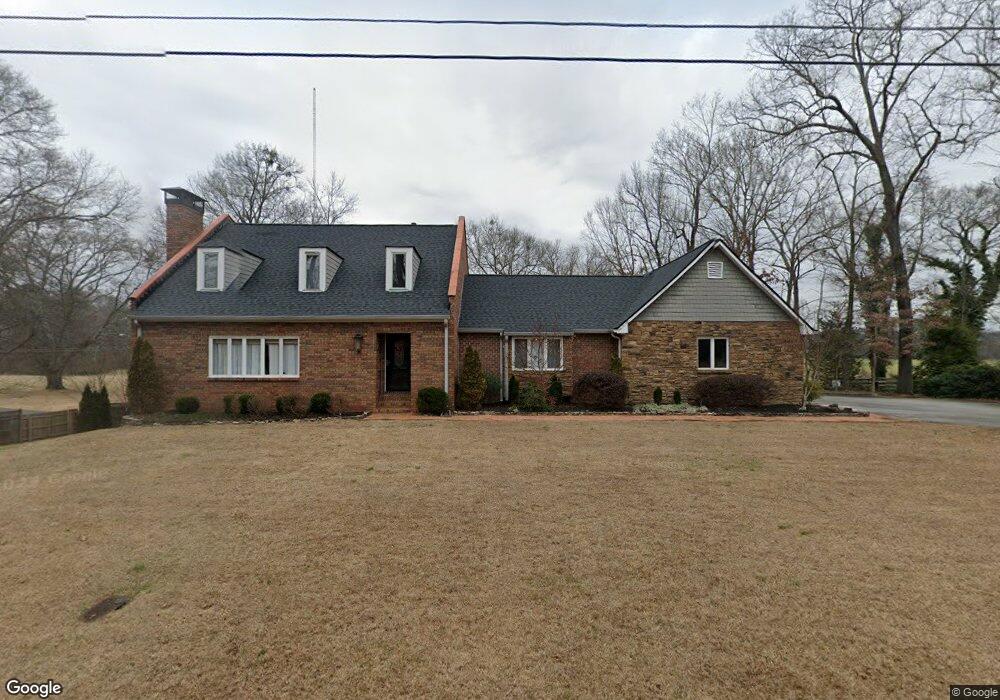
About This Home
This home is located at 1 Greenbriar Ln SE Unit 2, Rome, GA 30161 and is currently estimated at $601,651, approximately $202 per square foot. 1 Greenbriar Ln SE Unit 2 is a home located in Floyd County with nearby schools including Rome High School, St. Mary School, and Darlington School.
Ownership History
Date
Name
Owned For
Owner Type
Purchase Details
Closed on
Feb 24, 2021
Sold by
Cordle Teresa Garner
Bought by
Chivers Kenneth C and Chivers Helen L
Current Estimated Value
Purchase Details
Closed on
Feb 22, 2021
Sold by
Meade Megan
Bought by
Cordle Teresa Garner
Purchase Details
Closed on
Feb 21, 2020
Sold by
Cordle Teresa Garner
Bought by
Meade Megan and Cordle Teresa Garner
Purchase Details
Closed on
Nov 14, 2013
Sold by
Cordle Teresa Garner
Bought by
Cordle Teresa Garner
Purchase Details
Closed on
Jul 19, 2007
Sold by
Not Provided
Bought by
Cordle Robert Gregory
Purchase Details
Closed on
Feb 1, 1991
Sold by
Gross John L
Bought by
Cordle Joe and Cordle Frances
Purchase Details
Closed on
Aug 31, 1979
Sold by
Byars James Park
Bought by
Gross John L
Purchase Details
Closed on
Jul 27, 1973
Sold by
Hackett William E Mrs
Bought by
Byars James Park
Purchase Details
Closed on
Jan 1, 1970
Sold by
Hicks M G
Bought by
Hackett William E Mrs
Purchase Details
Closed on
Jan 1, 1901
Bought by
Hicks M G
Create a Home Valuation Report for This Property
The Home Valuation Report is an in-depth analysis detailing your home's value as well as a comparison with similar homes in the area
Home Values in the Area
Average Home Value in this Area
Purchase History
| Date | Buyer | Sale Price | Title Company |
|---|---|---|---|
| Chivers Kenneth C | $433,500 | -- | |
| Cordle Teresa Garner | -- | -- | |
| Meade Megan | -- | -- | |
| Cordle Teresa Garner | -- | -- | |
| Cordle Robert Gregory | -- | -- | |
| Cordle Robert Gregory | -- | -- | |
| Cordle Joe | $185,000 | -- | |
| Gross John L | $11,500 | -- | |
| Byars James Park | $12,500 | -- | |
| Hackett William E Mrs | $7,000 | -- | |
| Hicks M G | -- | -- |
Source: Public Records
Tax History Compared to Growth
Tax History
| Year | Tax Paid | Tax Assessment Tax Assessment Total Assessment is a certain percentage of the fair market value that is determined by local assessors to be the total taxable value of land and additions on the property. | Land | Improvement |
|---|---|---|---|---|
| 2024 | $8,133 | $213,054 | $21,000 | $192,054 |
| 2023 | $7,545 | $185,724 | $21,000 | $164,724 |
| 2022 | $5,762 | $157,901 | $20,000 | $137,901 |
| 2021 | $3,866 | $114,758 | $20,000 | $94,758 |
| 2020 | $3,834 | $111,279 | $20,000 | $91,279 |
| 2019 | $3,734 | $107,661 | $20,000 | $87,661 |
| 2018 | $3,632 | $101,790 | $18,000 | $83,790 |
| 2017 | $3,564 | $97,857 | $18,000 | $79,857 |
| 2016 | $3,563 | $97,248 | $18,000 | $79,248 |
| 2015 | $3,410 | $97,248 | $18,000 | $79,248 |
| 2014 | $3,410 | $97,248 | $18,000 | $79,248 |
Source: Public Records
Map
Nearby Homes
- 6 Haley Dr SE
- 411 Cooper Dr SE
- 311 Roswell Ave SE
- 138 E 8th Ave Unit 25
- 110 Smith St NE
- 121 Wadsworth St NE
- 226 Maplecrest Ln SE
- 1147 N Broad St Unit A & B
- 1208 N Broad St NE
- 303 Grady Ave NE
- 227 W Lakeshore Dr SE
- 13 Heard St NE
- 15 Heard St
- 2 Laporte St SE
- 122 Perkins St NE
- 115 Ross St NE
- 204 E 5th Ave
- 407 E 3rd St
- 311 Chambers St NE
- 304 Perkins St NE
- 1 Greenbriar Ln SE
- 2 Greenbriar Ln SE
- 3 Greenbriar Ln SE
- 4 Greenbriar Ln SE
- 0 Greenbriar Ln SE Unit 8301716
- 0 Greenbriar Ln SE Unit 8100063
- 0 Greenbriar Ln SE Unit 8584632
- 0 Greenbriar Ln SE Unit 7270570
- 0 Greenbriar Ln SE Unit 8377020
- 0 Greenbriar Ln SE Unit 8004587
- 0 Greenbriar Ln SE Unit 7447184
- 0 Greenbriar Ln SE Unit 8840467
- 0 Greenbriar Ln SE Unit 8931134
- 0 Greenbriar Ln SE Unit 2682245
- 0 Greenbriar Ln SE Unit 7083823
- 0 Greenbriar Ln SE Unit 7246382
- 0 Greenbriar Ln SE
- 535 Cooper Dr SE
- 534 Cooper Dr SE
- 537 Cooper Dr SE