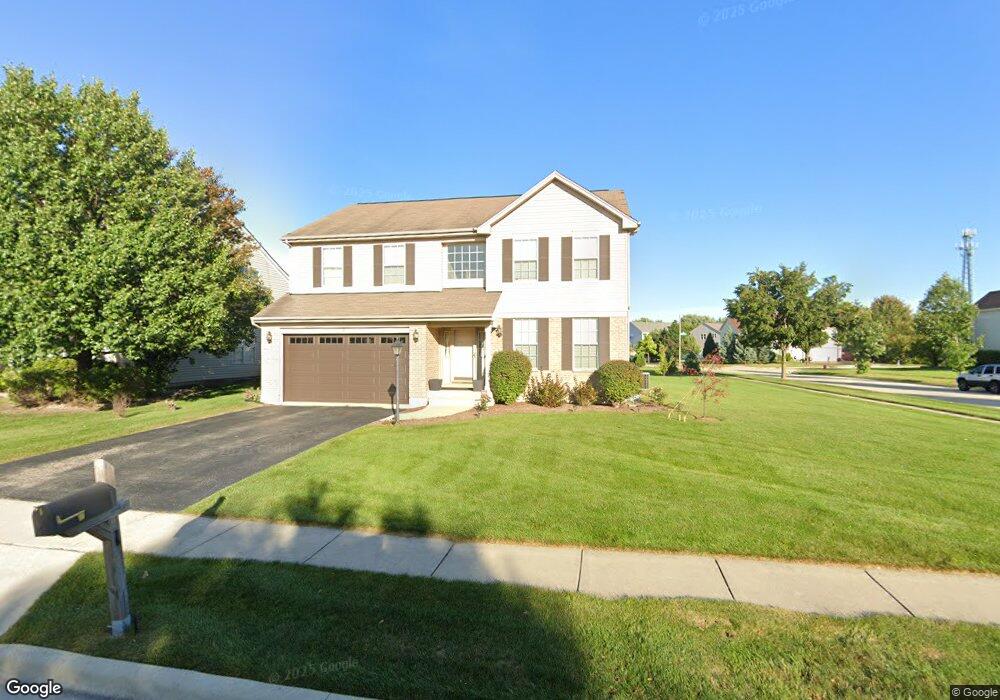
1 Greyshire Ct Algonquin, IL 60102
Estimated Value: $483,630 - $518,000
4
Beds
3
Baths
2,724
Sq Ft
$184/Sq Ft
Est. Value
About This Home
This home is located at 1 Greyshire Ct, Algonquin, IL 60102 and is currently estimated at $502,408, approximately $184 per square foot. 1 Greyshire Ct is a home located in Kane County with nearby schools including Westfield Community School and Harry D Jacobs High School.
Ownership History
Date
Name
Owned For
Owner Type
Purchase Details
Closed on
Dec 31, 2019
Sold by
Banks Gregory and Banks Lesia
Bought by
Banks Gregory and Banks Lesia
Current Estimated Value
Purchase Details
Closed on
Aug 14, 2008
Sold by
Jones Samuel A and Jones Luviner A
Bought by
Banks Gregory and Banks Lesia
Home Financials for this Owner
Home Financials are based on the most recent Mortgage that was taken out on this home.
Original Mortgage
$299,700
Outstanding Balance
$197,568
Interest Rate
6.42%
Mortgage Type
Purchase Money Mortgage
Estimated Equity
$304,840
Purchase Details
Closed on
Nov 29, 1999
Sold by
Willoughby Farms Ltd Partnership
Bought by
Jones Samuel A and Jones Luviner A
Home Financials for this Owner
Home Financials are based on the most recent Mortgage that was taken out on this home.
Original Mortgage
$212,556
Interest Rate
7.97%
Mortgage Type
FHA
Create a Home Valuation Report for This Property
The Home Valuation Report is an in-depth analysis detailing your home's value as well as a comparison with similar homes in the area
Purchase History
| Date | Buyer | Sale Price | Title Company |
|---|---|---|---|
| Banks Gregory | -- | Attorney | |
| Banks Gregory | $304,000 | Chicago Title Insurance Co | |
| Jones Samuel A | $234,000 | Stewart Title Company |
Source: Public Records
Mortgage History
| Date | Status | Borrower | Loan Amount |
|---|---|---|---|
| Open | Banks Gregory | $299,700 | |
| Previous Owner | Jones Samuel A | $212,556 |
Source: Public Records
Tax History
| Year | Tax Paid | Tax Assessment Tax Assessment Total Assessment is a certain percentage of the fair market value that is determined by local assessors to be the total taxable value of land and additions on the property. | Land | Improvement |
|---|---|---|---|---|
| 2024 | $9,747 | $136,702 | $26,492 | $110,210 |
| 2023 | $9,253 | $123,000 | $23,837 | $99,163 |
| 2022 | $9,005 | $115,308 | $23,837 | $91,471 |
| 2021 | $8,731 | $108,874 | $22,507 | $86,367 |
| 2020 | $8,555 | $106,426 | $22,001 | $84,425 |
| 2019 | $8,290 | $101,031 | $20,886 | $80,145 |
| 2018 | $8,346 | $99,030 | $20,472 | $78,558 |
| 2017 | $7,997 | $92,638 | $19,151 | $73,487 |
| 2016 | $7,789 | $85,566 | $18,543 | $67,023 |
| 2015 | -- | $77,960 | $17,040 | $60,920 |
| 2014 | -- | $72,244 | $16,569 | $55,675 |
| 2013 | -- | $74,455 | $17,076 | $57,379 |
Source: Public Records
Map
Nearby Homes
- 9 Greyshire Ct
- 2313 Barrett Dr
- 1240 Glenmont St
- 1101 Waterford St
- 1201 Waterford St
- 1211 Waterford St
- 1231 Waterford St
- 2224 Barrett Dr
- 120 Newburgh Ln
- 1235 Glenmont St
- 2250 Stonegate Rd
- 2258 Stonegate Rd
- 150 Newburgh Ln
- 2030 Cosman Way
- 2040 Cosman Way
- 301 Cold Spring St
- 2050 Cosman Way
- 2060 Cosman Way
- 1090 Glenmont St
- 1111 Glenmont St
- 3 Greyshire Ct
- 2324 Coneflower Ln
- 2320 Coneflower Ln
- 5 Greyshire Ct Unit 2
- 1841 Highmeadow Ln
- 2 Greyshire Ct
- 2316 Coneflower Ln
- 4 Greyshire Ct
- 7 Greyshire Ct
- 1830 Cooper Ln
- 1861 Highmeadow Ln
- 2312 Coneflower Ln
- 1850 Highmeadow Ln
- 1821 Cooper Ln
- 1840 Cooper Ln
- 1850 Cooper Ln
- 1871 Highmeadow Ln
- 2 Yorkshire Ct Unit 2
- 1860 Cooper Ln
- 1860 Highmeadow Ln
Your Personal Tour Guide
Ask me questions while you tour the home.