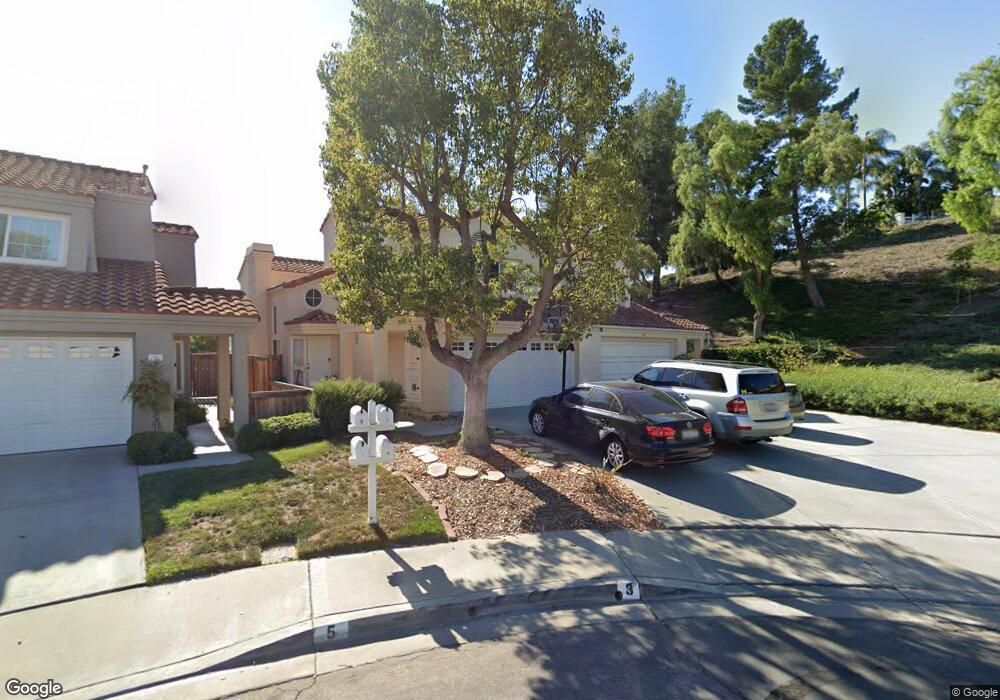
1 Gullwing Laguna Niguel, CA 92677
Laguna Heights NeighborhoodEstimated Value: $1,155,000 - $1,371,000
3
Beds
3
Baths
1,555
Sq Ft
$839/Sq Ft
Est. Value
About This Home
This home is located at 1 Gullwing, Laguna Niguel, CA 92677 and is currently estimated at $1,305,344, approximately $839 per square foot. 1 Gullwing is a home located in Orange County with nearby schools including George White Elementary, Niguel Hills Middle School, and Dana Hills High School.
Ownership History
Date
Name
Owned For
Owner Type
Purchase Details
Closed on
Jul 19, 2001
Sold by
Cook Charles P and Cook Diane P
Bought by
Kraai Dale L
Current Estimated Value
Home Financials for this Owner
Home Financials are based on the most recent Mortgage that was taken out on this home.
Original Mortgage
$275,000
Outstanding Balance
$105,593
Interest Rate
7.09%
Estimated Equity
$1,199,751
Purchase Details
Closed on
Jun 13, 1995
Sold by
Wiggins Lillian and Wiggins Lillian Katherine
Bought by
Cook Charles P and Cook Diane P
Home Financials for this Owner
Home Financials are based on the most recent Mortgage that was taken out on this home.
Original Mortgage
$170,250
Interest Rate
7.63%
Create a Home Valuation Report for This Property
The Home Valuation Report is an in-depth analysis detailing your home's value as well as a comparison with similar homes in the area
Home Values in the Area
Average Home Value in this Area
Purchase History
| Date | Buyer | Sale Price | Title Company |
|---|---|---|---|
| Kraai Dale L | $367,000 | Orange Coast Title Company | |
| Cook Charles P | $227,000 | Fidelity National Title Ins |
Source: Public Records
Mortgage History
| Date | Status | Borrower | Loan Amount |
|---|---|---|---|
| Open | Kraai Dale L | $275,000 | |
| Previous Owner | Cook Charles P | $170,250 | |
| Closed | Kraai Dale L | $42,000 |
Source: Public Records
Tax History
| Year | Tax Paid | Tax Assessment Tax Assessment Total Assessment is a certain percentage of the fair market value that is determined by local assessors to be the total taxable value of land and additions on the property. | Land | Improvement |
|---|---|---|---|---|
| 2025 | $5,397 | $542,157 | $328,800 | $213,357 |
| 2024 | $5,397 | $531,527 | $322,353 | $209,174 |
| 2023 | $5,283 | $521,105 | $316,032 | $205,073 |
| 2022 | $5,182 | $510,888 | $309,836 | $201,052 |
| 2021 | $5,082 | $500,871 | $303,761 | $197,110 |
| 2020 | $5,032 | $495,736 | $300,647 | $195,089 |
| 2019 | $4,933 | $486,016 | $294,752 | $191,264 |
| 2018 | $4,838 | $476,487 | $288,973 | $187,514 |
| 2017 | $4,744 | $467,145 | $283,307 | $183,838 |
| 2016 | $4,653 | $457,986 | $277,752 | $180,234 |
| 2015 | $4,583 | $451,107 | $273,580 | $177,527 |
| 2014 | $4,495 | $442,271 | $268,221 | $174,050 |
Source: Public Records
Map
Nearby Homes
Your Personal Tour Guide
Ask me questions while you tour the home.