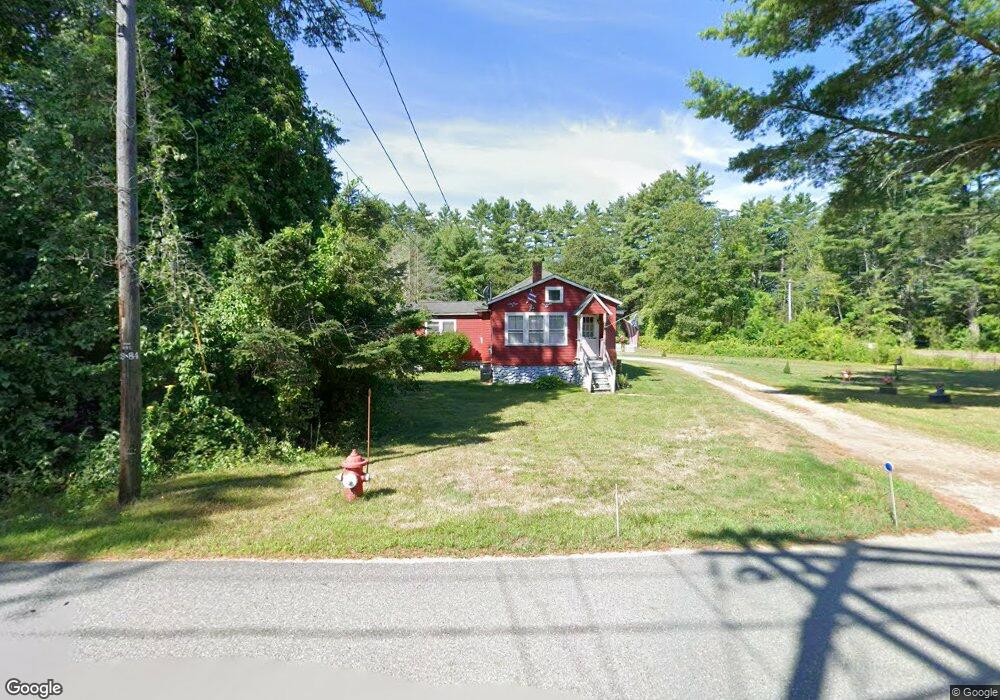
1 Hale St Winchendon, MA 01475
Estimated Value: $235,000 - $312,110
2
Beds
1
Bath
864
Sq Ft
$325/Sq Ft
Est. Value
About This Home
This home is located at 1 Hale St, Winchendon, MA 01475 and is currently estimated at $280,778, approximately $324 per square foot. 1 Hale St is a home located in Worcester County with nearby schools including Toy Town Elementary School, Memorial, and The Winchendon School.
Ownership History
Date
Name
Owned For
Owner Type
Purchase Details
Closed on
Jul 14, 2021
Sold by
Mabardy Charles
Bought by
580 River Street Llc
Current Estimated Value
Purchase Details
Closed on
May 14, 2020
Sold by
Dane Shaunesy L
Bought by
Barkley Enterprises Llc
Purchase Details
Closed on
Oct 26, 1987
Sold by
Mabardy Charles J
Bought by
Hale St Nom Trust
Home Financials for this Owner
Home Financials are based on the most recent Mortgage that was taken out on this home.
Original Mortgage
$55,000
Interest Rate
10.92%
Mortgage Type
Purchase Money Mortgage
Create a Home Valuation Report for This Property
The Home Valuation Report is an in-depth analysis detailing your home's value as well as a comparison with similar homes in the area
Home Values in the Area
Average Home Value in this Area
Purchase History
| Date | Buyer | Sale Price | Title Company |
|---|---|---|---|
| 580 River Street Llc | $225,000 | None Available | |
| 580 River Street Llc | $225,000 | None Available | |
| Barkley Enterprises Llc | $90,000 | None Available | |
| Barkley Enterprises Llc | $90,000 | None Available | |
| Hale St Nom Trust | $55,000 | -- |
Source: Public Records
Mortgage History
| Date | Status | Borrower | Loan Amount |
|---|---|---|---|
| Previous Owner | Hale St Nom Trust | $41,000 | |
| Previous Owner | Hale St Nom Trust | $55,000 |
Source: Public Records
Tax History
| Year | Tax Paid | Tax Assessment Tax Assessment Total Assessment is a certain percentage of the fair market value that is determined by local assessors to be the total taxable value of land and additions on the property. | Land | Improvement |
|---|---|---|---|---|
| 2025 | $1,578 | $134,300 | $50,900 | $83,400 |
| 2024 | $1,529 | $121,900 | $46,600 | $75,300 |
| 2023 | $1,490 | $111,200 | $44,400 | $66,800 |
| 2022 | $1,781 | $117,900 | $55,500 | $62,400 |
| 2021 | $1,674 | $106,500 | $49,000 | $57,500 |
| 2020 | $1,823 | $112,000 | $46,800 | $65,200 |
| 2019 | $1,775 | $106,200 | $43,800 | $62,400 |
| 2018 | $1,751 | $100,900 | $40,700 | $60,200 |
| 2017 | $1,563 | $87,000 | $38,800 | $48,200 |
| 2016 | $1,407 | $80,700 | $37,000 | $43,700 |
| 2015 | $1,349 | $80,700 | $37,000 | $43,700 |
| 2014 | $1,352 | $84,700 | $38,900 | $45,800 |
Source: Public Records
Map
Nearby Homes
Your Personal Tour Guide
Ask me questions while you tour the home.