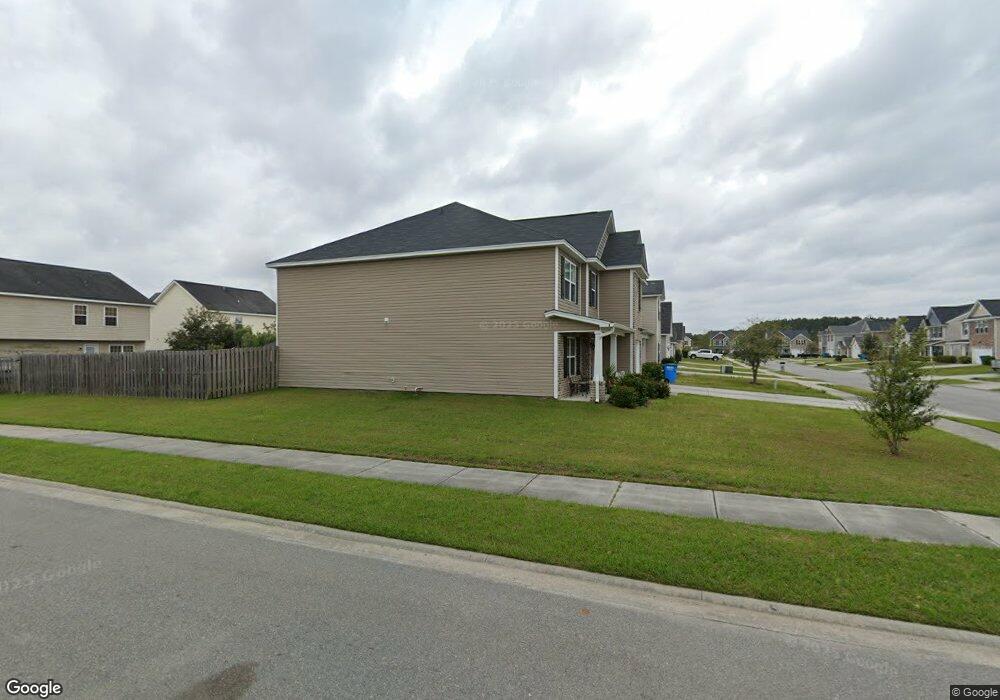
1 Heritage Rd Savannah, GA 31407
Estimated Value: $316,000 - $364,000
4
Beds
3
Baths
2,978
Sq Ft
$115/Sq Ft
Est. Value
About This Home
This home is located at 1 Heritage Rd, Savannah, GA 31407 and is currently estimated at $341,660, approximately $114 per square foot. 1 Heritage Rd is a home located in Chatham County with nearby schools including Rice Creek K-8 School and Groves High School.
Ownership History
Date
Name
Owned For
Owner Type
Purchase Details
Closed on
Aug 1, 2016
Bought by
Harris Marlon A and White Audrey L
Current Estimated Value
Home Financials for this Owner
Home Financials are based on the most recent Mortgage that was taken out on this home.
Original Mortgage
$216,505
Outstanding Balance
$170,495
Interest Rate
3.25%
Mortgage Type
FHA
Estimated Equity
$171,165
Purchase Details
Closed on
May 1, 2015
Sold by
Lamar Smith Signature Homes Llc
Bought by
Boomer Homes Inc
Purchase Details
Closed on
Mar 7, 2008
Bought by
Bls Development Inc
Create a Home Valuation Report for This Property
The Home Valuation Report is an in-depth analysis detailing your home's value as well as a comparison with similar homes in the area
Home Values in the Area
Average Home Value in this Area
Purchase History
| Date | Buyer | Sale Price | Title Company |
|---|---|---|---|
| Harris Marlon A | $220,500 | -- | |
| Boomer Homes Inc | $140,000 | -- | |
| Bls Development Inc | $252,900 | -- |
Source: Public Records
Mortgage History
| Date | Status | Borrower | Loan Amount |
|---|---|---|---|
| Open | Harris Marlon A | $216,505 |
Source: Public Records
Tax History Compared to Growth
Tax History
| Year | Tax Paid | Tax Assessment Tax Assessment Total Assessment is a certain percentage of the fair market value that is determined by local assessors to be the total taxable value of land and additions on the property. | Land | Improvement |
|---|---|---|---|---|
| 2025 | $5,225 | $156,520 | $30,000 | $126,520 |
| 2024 | $5,225 | $151,280 | $26,000 | $125,280 |
| 2023 | $3,826 | $141,560 | $20,000 | $121,560 |
| 2022 | $3,071 | $110,080 | $14,000 | $96,080 |
| 2021 | $3,079 | $95,680 | $14,000 | $81,680 |
| 2020 | $3,000 | $93,120 | $14,000 | $79,120 |
| 2019 | $3,000 | $91,560 | $12,000 | $79,560 |
| 2018 | $2,911 | $88,400 | $12,000 | $76,400 |
| 2017 | $2,475 | $81,160 | $12,600 | $68,560 |
| 2016 | $413 | $12,600 | $12,600 | $0 |
| 2015 | $236 | $7,200 | $7,200 | $0 |
| 2014 | $348 | $7,200 | $0 | $0 |
Source: Public Records
Map
Nearby Homes
- Dayton Plan at Brookline
- Spring Valley II Plan at Brookline
- Stillwater Plan at Brookline
- Grayson TR Plan at Rice Creek
- Richmond Plan at Brookline
- Spring Garden TR Plan at Rice Creek
- Crestview Plan at Brookline
- Spring Valley II TR Plan at Rice Creek
- Bismarck II TR Plan at Rice Creek
- Blue Ridge TR Plan at Rice Creek
- Crestview TR Plan at Rice Creek
- Pinehurst II Plan at Brookline
- Avery Plan at Brookline
- Brookline Plan at Brookline
- 17 Sea Oats Dr
- 109 Miller Park Cir
- 87 Marsh Salt Ln
- 106 Marsh Salt Ln
- 84 Marsh Salt Ln
- 93 Marsh Salt Ln
- 1 Heritage Rd
- 3 Heritage Rd
- 5 Heritage Rd
- 5 Heritage Woods
- 5 Heritage Woods Unit 5
- 24 Rice Creek Rd
- 24 Rice Creek Rd
- 26 Rice Creek Rd
- 26 Rice Creek Rd
- 2 Heritage Rd
- 54 Burnt Oak Rd
- 4 Heritage Rd
- 28 Rice Creek Rd
- 28 Rice Creek Rd
- 56 Burnt Oak Rd
- 4 Heritage Woods
- 4 Heritage Woods Unit 5
- 7 Heritage Rd
- 52 Burnt Oak Rd
- 58 Burnt Oak Rd